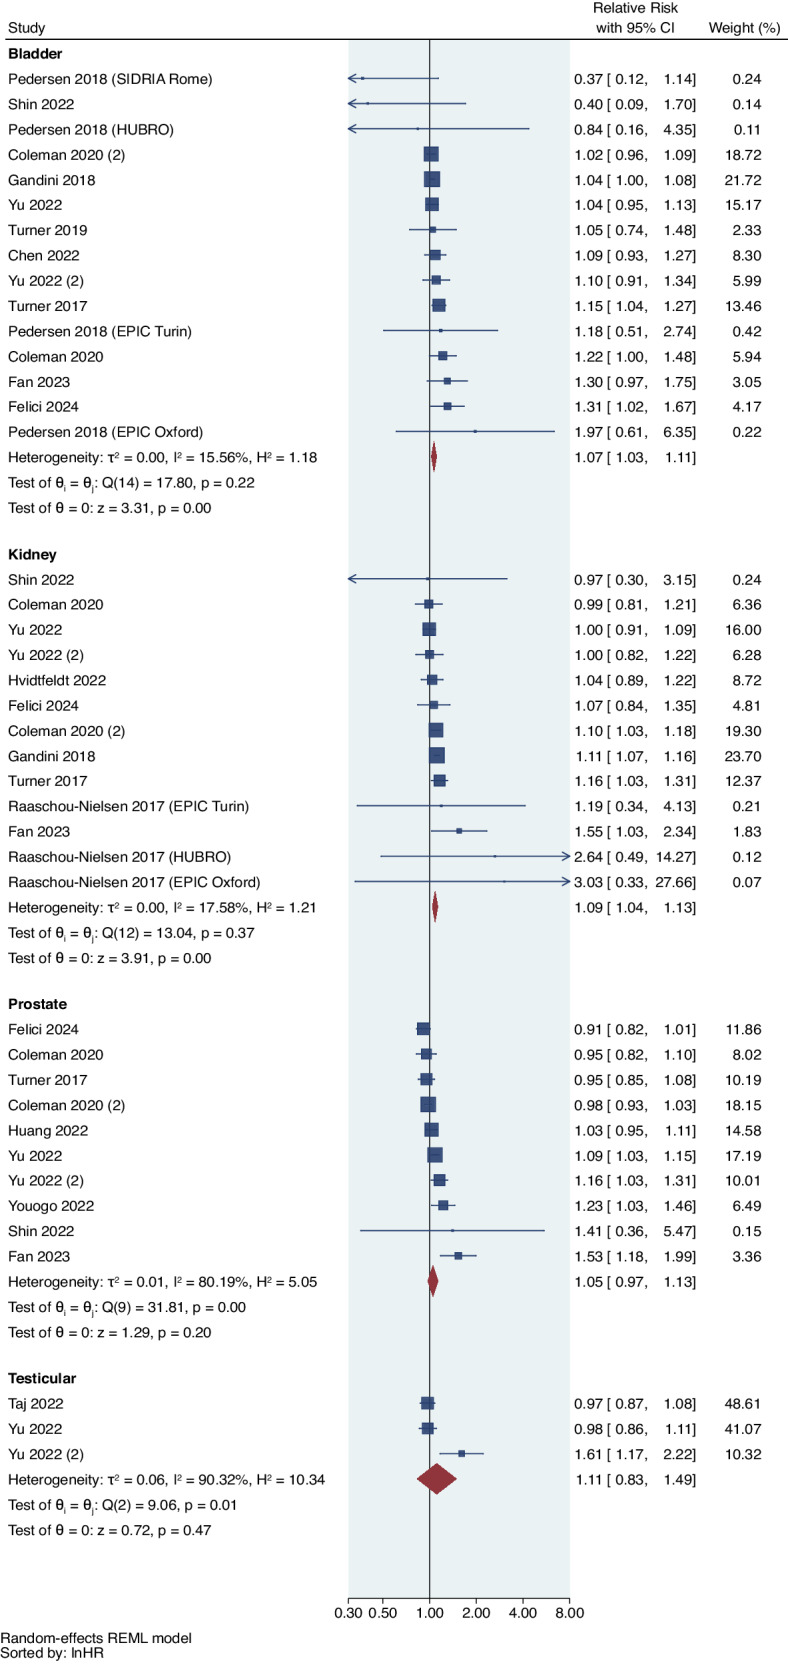
Fig. 2. Forest plot of studies reporting PM2.5 exposure and urological cancer risk.

Meta-analysis of evidence on the association between a 5 μg/m3 increase in PM2.5 and risk of individual urological cancers using random effects meta-analysis. The square represents the relative risk and the bar represents the 95% confidence interval (CI) from each study (n = 41 association estimates which are independent for each cancer type). All statistical tests are two-sided.
