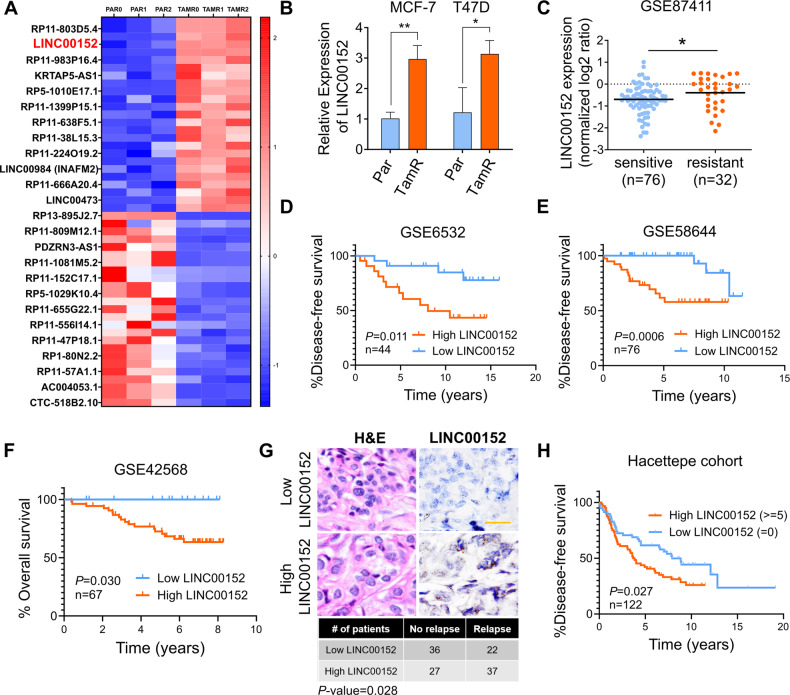
Fig. 1. LINC00152 is upregulated in tamoxifen resistance and its higher expression correlates with poor prognosis.
A Heatmap of the z-scores of the FPKM values of the top 25 most abundant, upregulated, and top 25, least abundant, downregulated lncRNAs in MCF-7 tamoxifen-resistant (TAMR) cells compared to parental (Par) cells in three biological replicates (0, 1, 2). The names of 25 genes are depicted on the heatmap. Red indicates upregulation and blue indicates downregulation in TamR cells. B qRT-PCR analysis of LINC00152 in both MCF-7 and T47D.Par and TamR cells. C LINC00152 levels in tamoxifen sensitive vs. resistant tumors at baseline from GSE87411. D, E The disease-free survival in tamoxifen-treated ER+ breast cancer patients with tumors expressing low vs. high LINC00152 expression from GSE6532 (D) and GSE58644 (E). F The overall survival in patients with tumors expressing low vs. high LINC00152 expression from GSE42568. G Representative in situ hybridization (ISH) staining of LINC00152 in low vs. high expressers among endocrine therapy-treated ER+ breast carcinoma specimens from the Hacettepe cohort. Scale bar = 20 µm. The numbers of Hacettepe patients having low vs high LINC00152 and with recurrence vs. no recurrence are provided at the bottom of the panel. H The disease-free survival in Hacettepe patients with tumors expressing low vs. high LINC00152 expression as quantified by ISH staining. Data are presented as mean values ± standard deviation (SD). P-values for the bar graphs and boxplots were calculated with the unpaired, two-tailed Student’s t-test. The significance for the Kaplan–Meier survival graphs was calculated with the Log-rank test. The chi-square test was used for (G). *P < 0.05, **P < 0.01.

