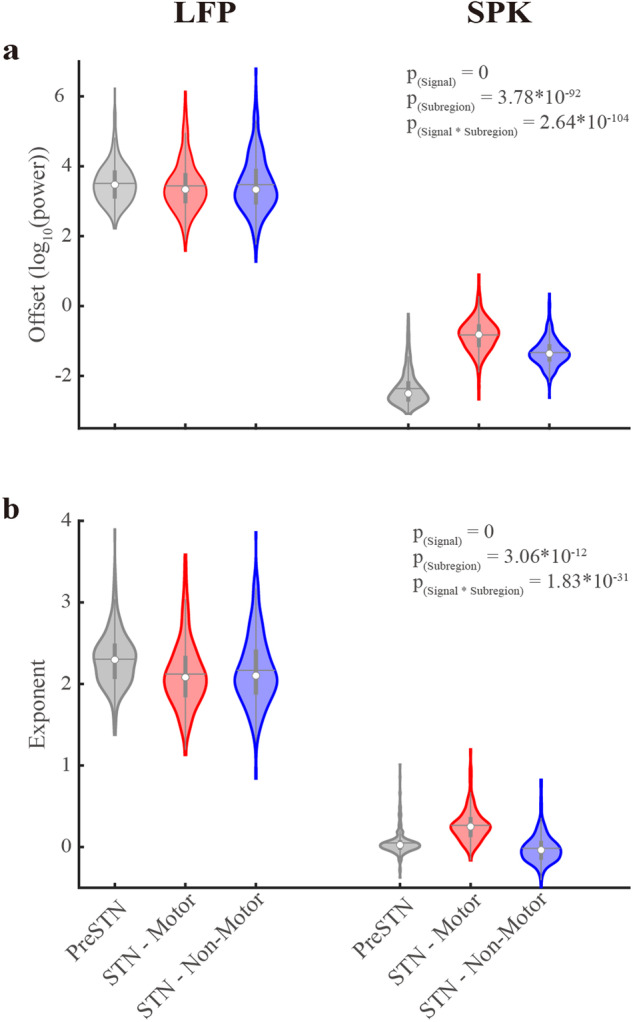
Fig. 2. Significant differences in aperiodic parameters of LFP and spiking (SPK) activity in the subregions of the subthalamic nucleus.

a The aperiodic offset parameter of LFP and SPK in three STN sub-regions. b As (a), but for the aperiodic exponent parameter. The pre-STN and the STN motor and non-motor domains are shown in gray, red, and blue, respectively. The contour of the violin plots shows the distribution of the data. The white circle shows the median. The horizontal gray line represents the mean. The gray vertical bold lines span from the 25th to the 75th percentiles of the sample, and the length of this line is the interquartile range. The lowest and highest whiskers of the violin plots are values that are 1.5 times the interquartile range below the 25th percentile and above the 75th percentile. The N-way analysis of variance was used to analyze the difference in aperiodic parameters. The P(Signal), P(Subregion), and P(Signal*Subregion) represent the statistical probability for a significant difference in offset or exponent values between LFP and spiking (SPK) activity, for a difference of offset or exponent values between the three STN subregions, and for the interaction effect of offset and exponent values between the signal types and sub-regions. Detailed results of multiple comparisons are shown in Supplementary Table 2. See also Supplementary Figs. 3–7.
