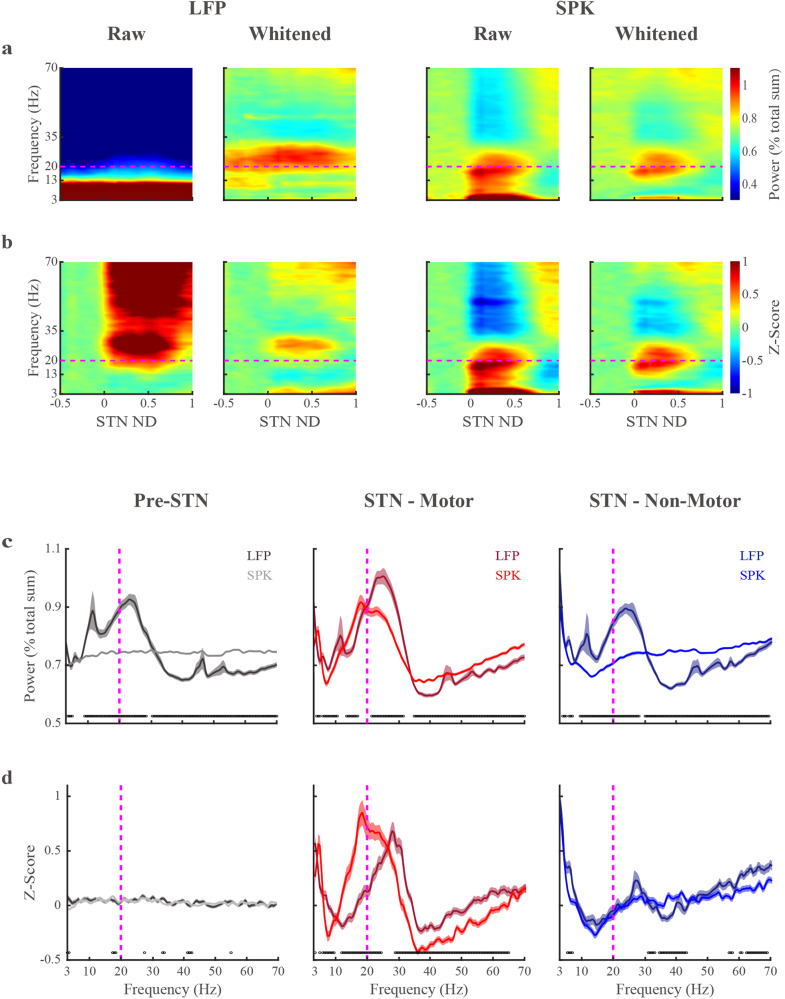
Fig. 3. Raw and whitened averaged spectrograms and power-spectrum densities (PSD) reveal differences in beta frequency distribution and peak beta oscillations between LFP and spiking (SPK) activity in the motor domain of the subthalamic nucleus.
a Raw and whitened spectrograms of LFP and SPK are normalized by the total amount of power in the tested frequency range (3–70 Hz) for each tested recording site (normalization by frequency). b The raw and whitened spectrograms are normalized by frequency (as in (a)) and by the power in the pre-STN domain per each frequency bin (normalization by distance). The spectrograms in the second and fourth columns of (a, b) are whitened in the frequency domain (Eq. (2), pwelch-FOOOF-whitening). The x-axis is the normalized distance (ND, normalized STN length from entry to exit equals 1). The entrance and exit of STN are represented by 0 and 1, respectively. The negative values on the x-axis indicate the pre-STN region. The y-axis is the frequency on a linear scale. The color scale of the power spectral density normalized by frequency (a) indicates the percentage power of the frequency bin out of total power. The color scale of the power spectral density normalized by frequency and distance (b) represents the deviation from the mean value of the first ten depths in pre-STN (z-score, standard deviation unit). c The PSDs of LFP and SPK are normalized by frequency in three sub-regions. d As in (c) but normalized by frequency and by distance (Pre-STN activity). The dark and light lines indicate the LFP and SPK in the pre-STN (gray) and the STN motor (red) and non-motor (blue) domains, respectively. Their corresponding shade lines indicate SEM. The black circles above the X-axes indicate frequencies at which there were significant differences (Wilcoxon rank sum test) between LFP and spiking activity. The horizontal (a, b) and vertical (c, d) magenta dashed lines are the referenced line of 20 Hz. See also Supplementary Fig. 8.

