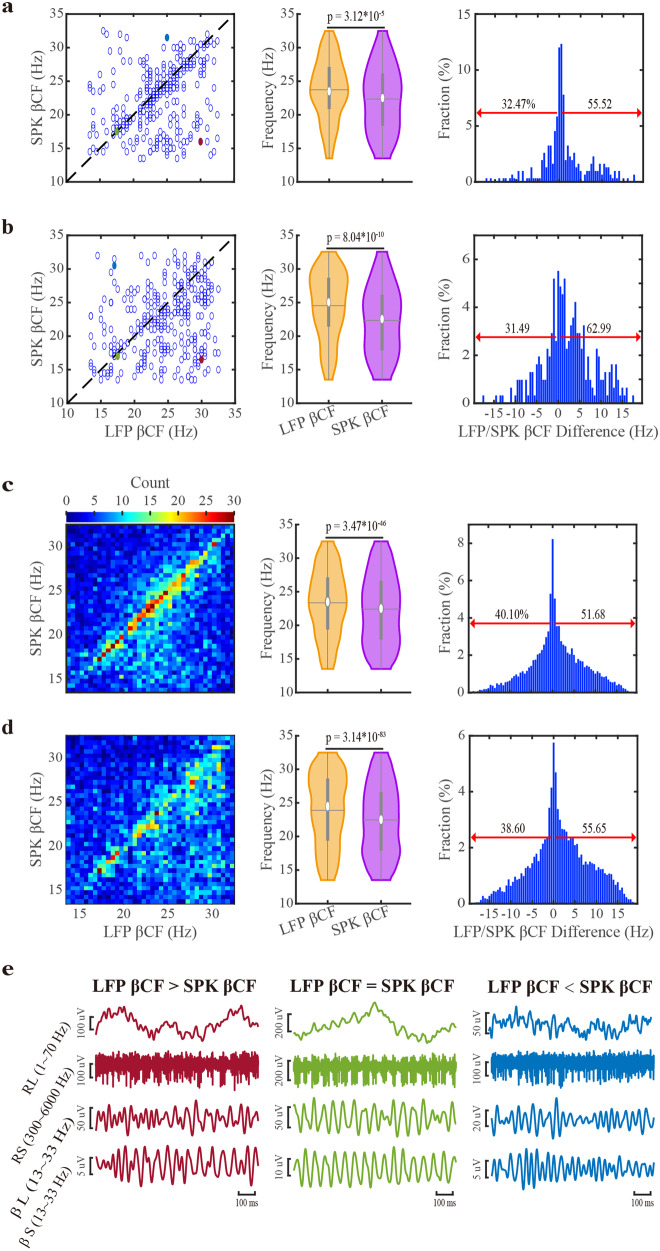
Fig. 4. Downshift of the center frequency of beta oscillations of spiking (SPK) activity compared to LFP within the motor subdomain of the subthalamic nucleus.
a, b Raster display, violin distribution, and the fraction of down- and up-shift of LFP and SPK center frequency of beta oscillations (βCFs) of STN trajectories. c, d As in (a, b), but the unit of βCFs is a single recording site. The βCFs are obtained from the frequency-normalized power spectra in the (a, c) subplots and from the frequency- and distance-normalized power spectra in the (b, d) subplots. The dark dashed lines on the left panel of (a, b) are the diagonal lines (at which x = y). The violins in the middle panel of (a, b, c, d) demonstrate the distribution of βCFs of LFP and SPK. The significance levels shown in the violin plots were calculated using the Wilcoxon signed rank test. In the right panel, the red arrows indicate the percentage of SPK βCFs that were upshifted (left) and downshifted (right) compared to the corresponding LFP βCFs. e shows the raw signals of three examples (LFP βCF is larger than, equal to, or smaller than SPK βCF, from left to right). The examples shown in (e) are marked in the corresponding colors (red, green, and blue) on the left panel of (a, b). RL raw LFP, RS raw SPK, βL β frequency band of LFP, βS β frequency band of SPK. See also Supplementary Figs. 9, 10.

