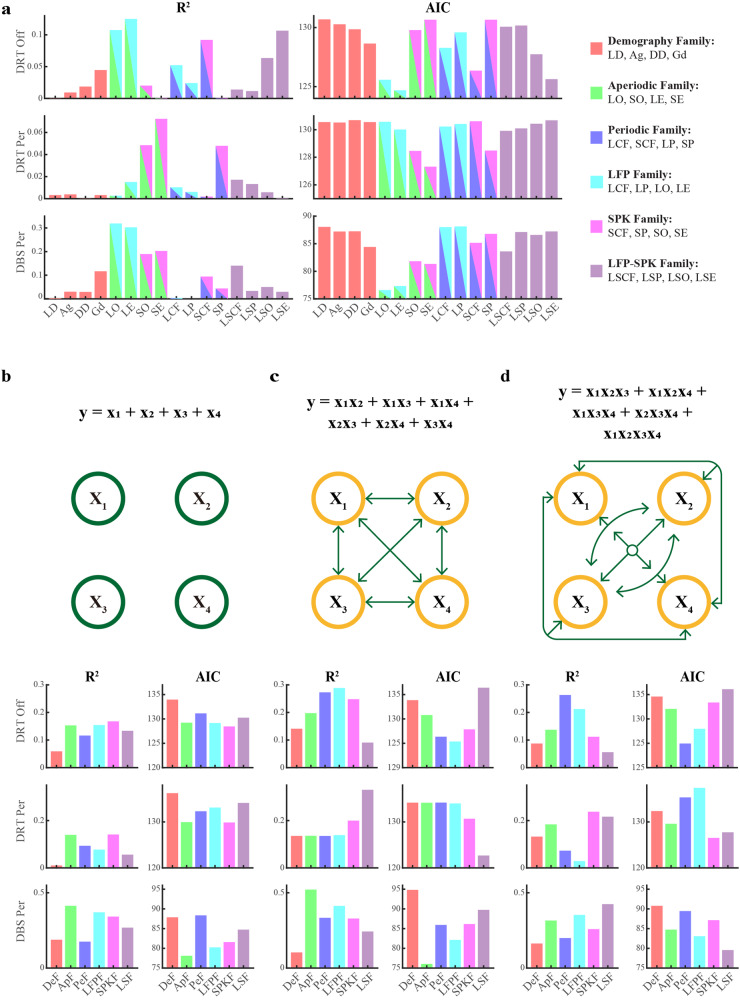
Fig. 6. Evaluating predictive factors for pre- and post-operative clinical scores in patients with Parkinson’s disease.
a The predictive relationship (R2) between individual predictors and responses (The pre-operative UPDRS III scores off dopamine replacement therapy (DRT Off), its percentage change due to pre-operative medication (DRT Per), and its percentage change due to DBS (DBS Per), and their corresponding Akaike Information Criterion (AIC, lower values indicate more probable fitting models). The individual predictors are levodopa daily equivalent dose (LD), age (Ag), disease duration (DD), gender (Gd), LFP beta center frequency (LCF), SPK beta center frequency (SCF), LFP beta peak power (LP), SPK beta peak power (SP), the difference between LCF and SCF (LSCF), LP and SP (LSP), LFP offset (LO), SPK offset (SO), LFP exponent (LE), SPK exponent (SE), the difference between LO and SO (LSO), and LE and SE (LSE). Predictor families are categorized as follows: Demography (DeF, red), Aperiodic (ApF, bright green), Periodic (PeF, blue), LFP (LFPF, cyan), SPK (SPKF, magenta), and the LFP-SPK differential (LSF, light purple). The elements of the predictor families are given in the top-right legend. b Goodness-of-fit (R2) and AIC for zeroth-order interaction of members in a predictor family. The color-coding matches (a). This represents the independent actions of the constitute members in a predictor family (like the formula and schematic diagram shown on the top of subplot (b). X1, X2, X3, and X4 indicate the four members in a family). c R2 and AIC for first-order interaction of members in a predictor family. This general linear model integrates the interaction of each two members in a family, and their fitting formula and schematic diagram are demonstrated on the top of subplot (c). d R2 and AIC of higher-order general linear model fitting. The higher-order fitting indicates the integration of the interaction of each three members and the interaction of all (four) members in a family. The corresponding fitting formula and schematic diagram are demonstrated on the top of subplot (d). The predictor families in subplots (c, d) are identical to those in (b), and colors correspond to the predictor families in (a). See also Supplementary Figs. 13–16.

