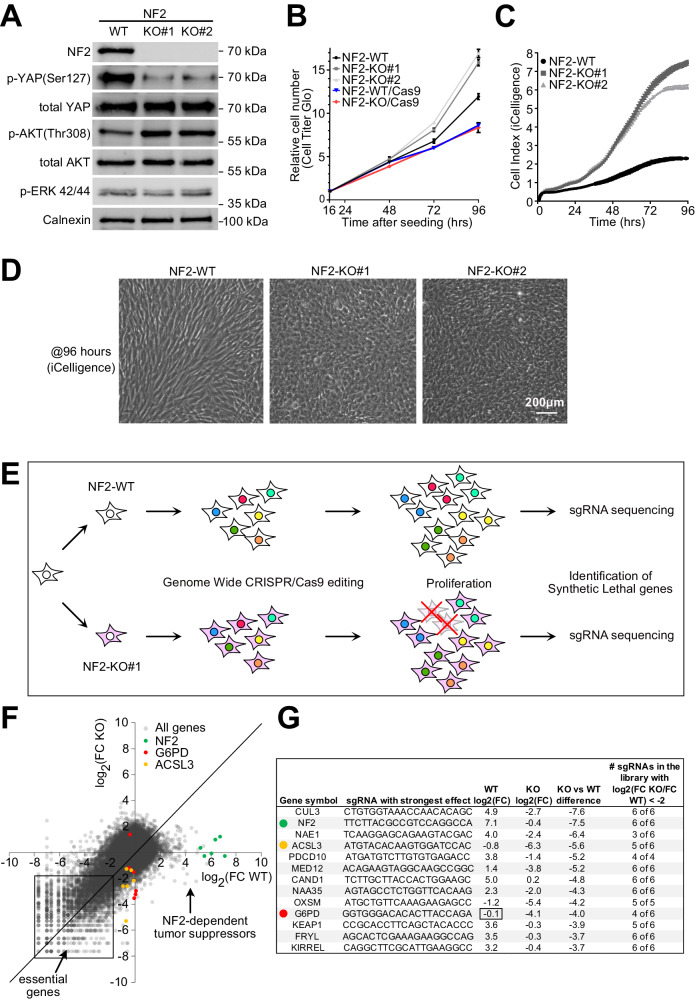
Fig. 1. Synthetic lethality screen identifies G6PD and ACSL3 as NF2-synthetic-lethal genes.
A NF2 knockout (NF2-KO) cells have reduced YAP phosphorylation and elevated Akt phosphorylation. Western blot analysis of lysates from isogenic NF2 WT and KO human Schwann cell lines. pERK 42/44: pThr 202/pTyr204. B At low cell density (2500 cells/0.32cm2), NF2-KO cells proliferate at roughly the same rate as NF2-WT cells. Relative cell number measured by CellTiter-Glo. Results are shown as a fold-change relative to the first timepoint (16 hrs postseeding). n = 4 wells. Bars = mean ± SD. C NF2-KO cells are not contact inhibited compared to NF2 WT cells. Real-time, impedance-based (iCelligence) cell growth analysis of NF2 WT and KO isogenic Schwann cells starting at medium confluence (5000 cells/0.32cm2). n = 4 wells. Bars = mean ± SD. D At high confluence, NF2 KO Schwann cells are more packed and less elongated compared to NF2 WT cells. Images taken at full confluence (96 hrs timepoint from panel C). Representative of >20 experiments. E Schematic diagram of the genome-wide synthetic lethality screen to identify genes that are synthetic-lethal with NF2 loss-of-function. F Scatter plot of the abundance of each sgRNA from the library at passage 7 (endpoint) normalized to passage 0 for both NF2-WT (x-axis) and NF2-KO#1 (y-axis) cells. Each dot represents a single sgRNA, and abundance is calculated as the log2 Fold Change (FC) of passage 7 / passage 0. G Top hits showing a differential proliferative/viability effect in NF2 KO cells compared to NF2-WT cells. Source data are provided as a Source Data file.

