
Figure 1.
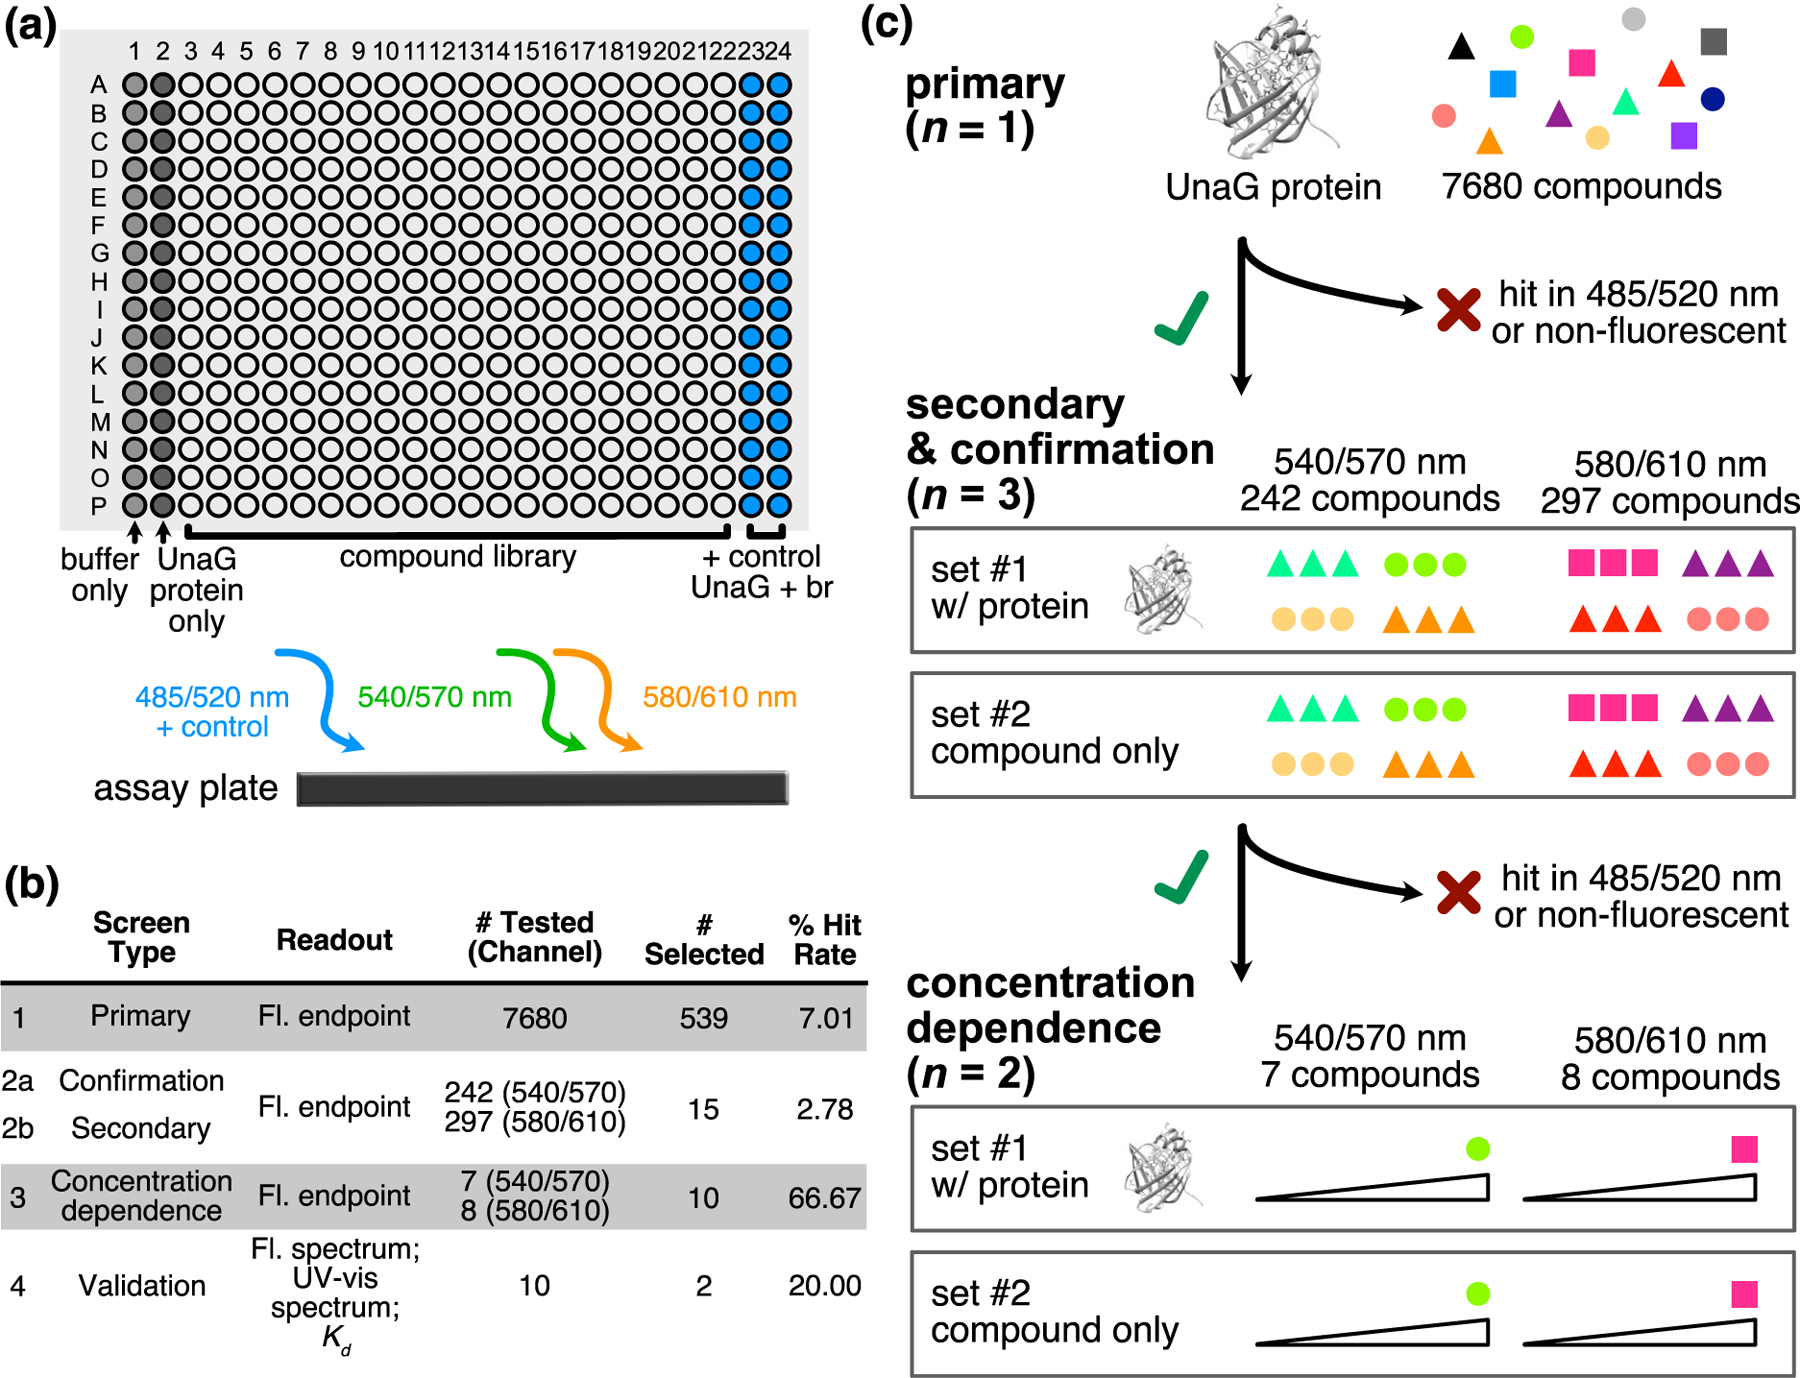
Screening methodology for identifying new, red-shifted ligand–UnaG pairs. (a) Schematic of primary HTS assay. Compounds were incubated with UnaG protein in 384-well black-walled plates before fluorescence intensity end-point reads using three optics modules. Columns 1 and 2 were reserved for negative controls, and columns 23 and 24 were reserved for positive controls of UnaG and bilirubin (br) for the 485/520 nm module. (b) Summary of HTS campaign. (c) Workflow logic used to cull hit lists from the three optics modules.