
Figure 5.
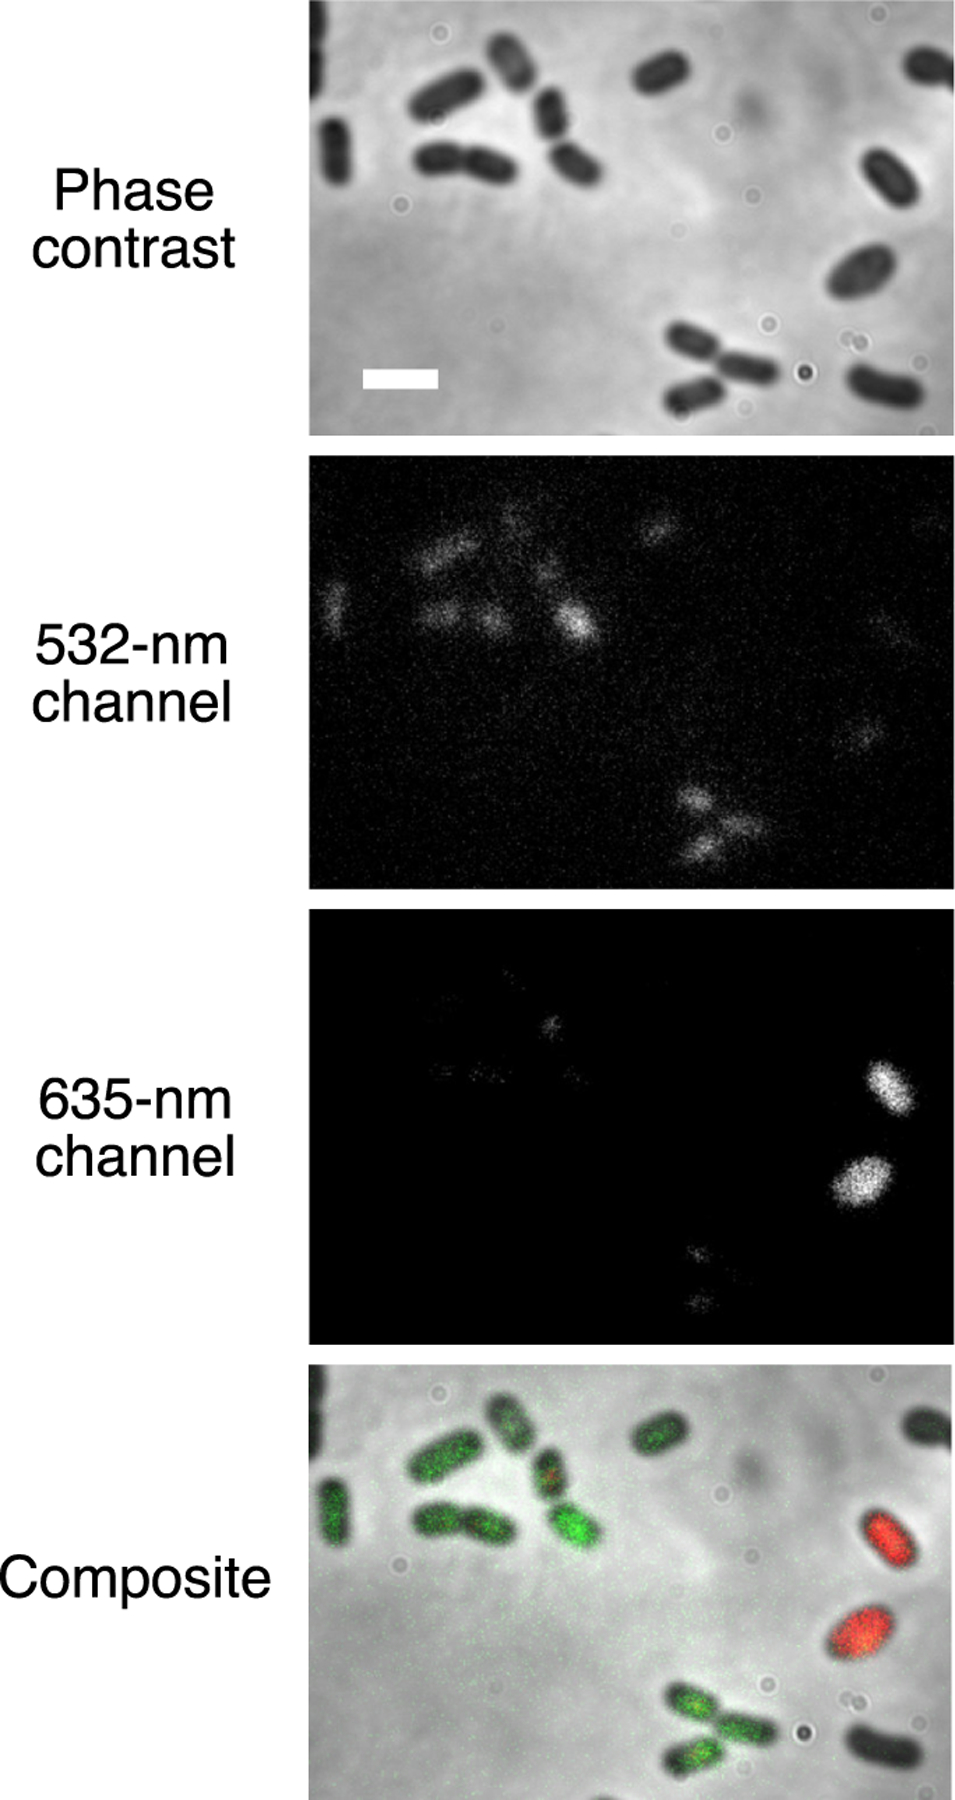
Phase-contrast and fluorescence images of a mixed culture of B. ovatus and B. theta expressing different BBFPs. B. ovatus expressing UnaG and labeled with 2 (green, 532 nm excitation) is distinguished from B. theta expressing IFP2.0 and labeled with biliverdin (red, 635 nm excitation) in separate color channels. Scale bar: 2 μm.