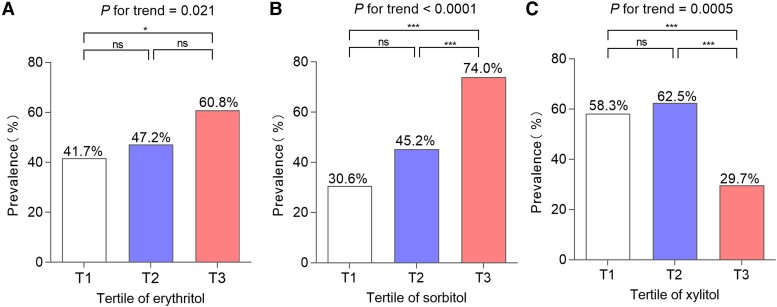
Figure 2.
The prevalence of GDM according to serum polyols tertiles. (A) Erythritol: T1, <2.86 µmol/L; T2, 2.86-3.32 µmol/L; T3, ≥3.31 µmol/L. (B) Sorbitol: T1, <1.32 µmol/L; T2, 1.32-1.69 µmol/L; T3, ≥1.69 µmol/L. (C) Xylitol: T1, <1.39 µmol/L; T2, 1.39-1.81 µmol/L; T3, ≥1.81 µmol/L. The chi-square test and chi-square test for trend were used to compare the prevalence of GDM and calculate P for trend and P values. P < .05 was considered to be statistically significant. nsP > .05, ***P < .001, and *P < .05. Abbreviation: T, tertile.

