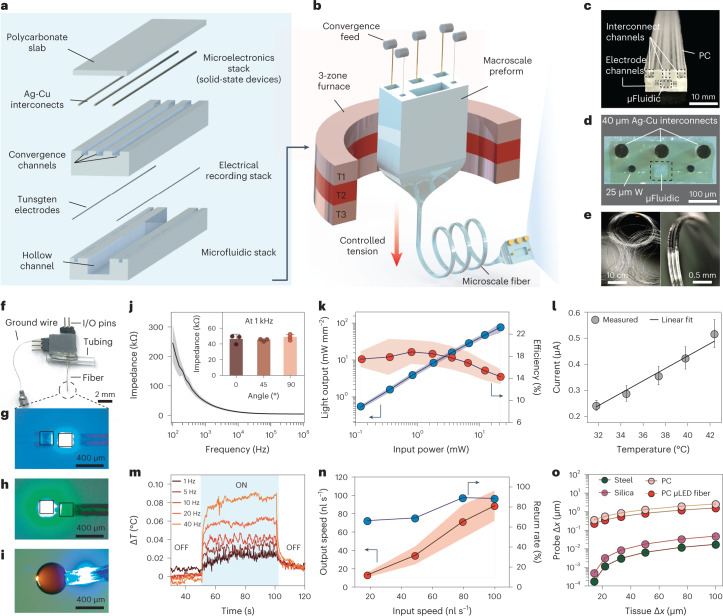
Fig. 2. Fabrication and characterization of multifunctional brain fibers.
a, Preform layout and assembly of a multifunctional brain fiber that comprises interconnect channels in the central PC layer and a precursor to microfluidic channel and recording electrodes in the bottom PC layer. b, Schematic of the thermal drawing process with simultaneous feeding of interconnect microwires (40 µm Ag-Cu) and recording electrodes (25 µm tungsten). c, Photograph of the preform highlighting channels for interconnects, electrodes and microfluidics. d, An optical micrograph of a fiber cross-section showing conserved features. e, Several meters of as-drawn fiber depicting the scalability of fabrication (left) and a close-up view of an acutely bent flexible fiber (right). f, A fully assembled multifunctional fiber device with I/O pins for microelectrodes and µLEDs, access tubing for microfluidic channel and a ground wire. g,h, Independently addressable blue (g) and green (h) μLEDs at the distal end of the device. i, Simultaneous microfluidic fluid delivery and blue µLED under operation at the device tip. j, Electrochemical impedance spectrum of the tungsten microelectrodes in 1 × PBS (n = 3 independent samples). Inset shows variation of electrode impedance with bending deformation. k, Optical intensity output (blue trace) and efficiency (red trace) of μLED (λ = 470 nm) integrated within a fiber with varying input electrical power (n = 6 independent samples), where arrows indicate the y axes for respective plots. l, Steady-state calibration curve of the in-fiber thermal sensor at 32–42 °C (n = 4 independent samples). m, Variation of local temperature as recorded by the thermal sensor during operation of an adjacently placed blue μLED on the same fiber at different stimulation frequencies (35.2 mW mm−2, 10-ms pulse). n, Characterization of the fiber microfluidic channel showing output speed (red trace) and return rate (blue trace) at varying input injection speeds (n = 4 independent samples), where arrows indicate the y axes for respective plots. o, Mechanical finite element model compares the displacement of the probe tip for steel, silica, bare PC fiber and microelectronic PC fiber at displacements of the brain tissue between 10 and 100 µm. All shaded areas and error bars represent s.d.; data are presented as mean ± s.d. µFluidic, microfluidic.

