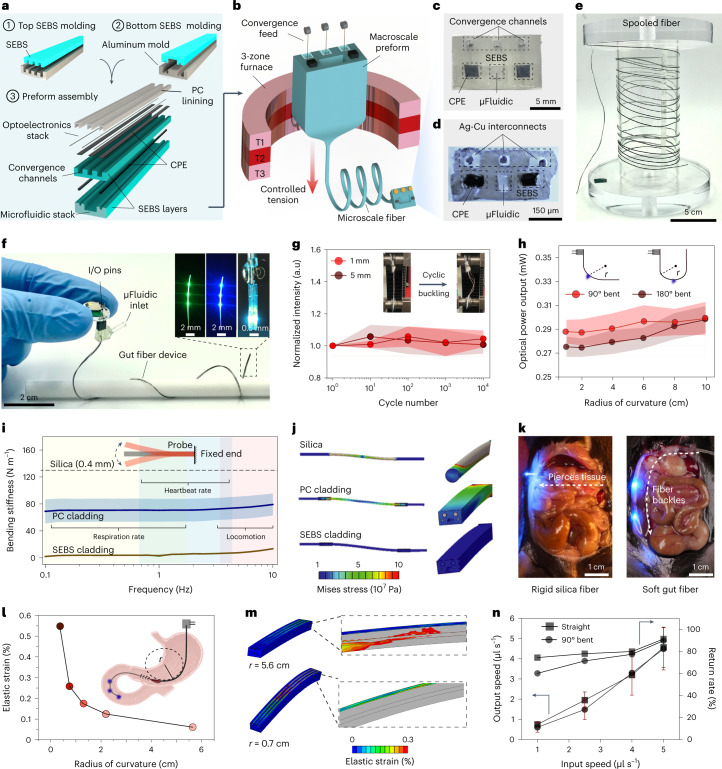
Fig. 3. Fabrication and characterization of soft, multifunctional gut fiber.
a, Layout of the multilayered gut fiber preform, where SEBS layers for convergence and microfluidic channel are molded from an inverse aluminum mold followed by preform assembly. b, The resultant preform is drawn into several meters of soft fiber using convergence-based thermal drawing. c, Digital image showing the cross-section of an assembled preform. d, Cross-sectional micrograph of the gut fiber highlighting conserved features. e, Several meters of as-drawn fiber wrapped around a spooler demonstrating scalable fabrication. f, Digital image of a multifunctional gut fiber device. Inset shows three green (left) and blue μLEDs (middle) on the fiber and dual optofluidic modality (right), where infusion of a PBS bolus is accompanied by operation of a blue μLED. g, Cyclic buckling of the gut fiber over 104 cycles at 1-mm and 5-mm displacements and corresponding normalized light output from the fiber μLED (n = 3 independent samples). h, Light output from fiber μLEDs subjected to deformations at radii of curvature of 90° (n = 3 independent samples) and 180° angles (n = 3 independent samples). i, Bending stiffness of the fiber with SEBS cladding (n = 3 independent samples) and PC cladding (n = 3 independent samples) with identical cross-sections in comparison with a 400-µm silica waveguide (dashed). j, Mechanical FEM depicting stress distribution profiles in rigid silica (top), stiff PC (middle) and soft SEBS (bottom) fibers. k, Intraluminal implantation of a rigid silica fiber results in rupture of intestinal tissue (left), while soft gut fiber permits intestinal implantation that can negotiate the luminal curvature without tissue damage. l, FEM simulated elastic strain in Ag-Cu interconnects at varying radii of curvature. m, Corresponding spatial strain distribution in a gut fiber bent at radii of curvature of 5.6 cm (top) and 0.7 cm (bottom). n, Microfluidic return rate through the gut fiber at injection speeds between 1 and 5 µl s−1 relevant to intraluminal nutrient infusion in a straight and bent geometry (n = 3 independent samples). All shaded areas and error bars represent s.d.; data are presented as mean ± s.d. CPE, carbon doped polyethylene; r, radius.

