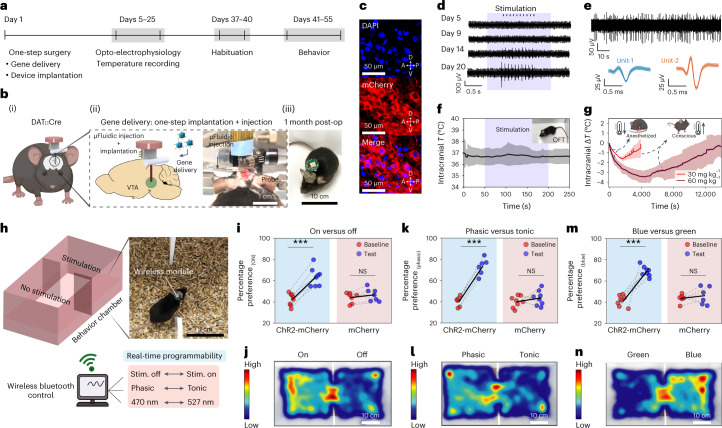
Fig. 5. Multimodal interrogation of deep-brain neural circuit and wireless programmable optogenetics during behavior.
a, Experimental timeline for in vivo validation of various fiber functionalities. b, Gene delivery through the microfluidic channel and fiber implantation in the same surgical procedure (i); photograph of one-step surgery highlights the fluid injection setup and the implanted fiber probe (ii); fully recovered animal ~1 month postsurgery carrying a wireless module (iii). c, Expression of Cre-dependent ChR2-mCherry construct 4 weeks following microfluidic AAV5 delivery into the VTA of DAT::Cre mice; (top) blue, DAPI; (middle) red, mCherry; (bottom) merge. d, Longitudinal electrophysiological recording of optically evoked neural activity in the VTA following AAV5 delivery. e, Spontaneous neural activity recorded from VTA at week 4 postimplantation (top); corresponding average action potential waveforms of two isolated neurons (bottom). f, Wireless intracranial temperature recording in mice (n = 6) exploring an open-field chamber during simultaneous wireless photostimulation (shaded region). g, Fiber thermal sensors detect brain hypothermia in the VTA induced by intraperitoneal injection of ketamine-xylazine mixture at 30-mg kg−1 (n = 3 mice) and 60-mg kg−1 (n = 3 mice) doses. h, Place preference assay during real-time wirelessly programmable optical stimulation in DAT-Cre mice. i,k,m, Percentage preference to the chamber coupled to the rewarding optical stimulation at baseline and on test day for mice transduced with ChR2-mCherry or mCherry in the VTA at three different wireless photostimulation conditions (top). i, On versus off. ChR2-mCherry: P = 4.16 × 10⁻⁵, t = –9.03, d.f. = 7; mCherry: P = 0.183, t = –1.50, d.f. = 6. k, Phasic versus tonic. ChR2-mCherry: P = 2.02 × 10⁻⁴, t = –9.65, d.f. = 5; mCherry: P = 0.403, t = –0.88, d.f. = 7. m, Blue-light versus green-light stimulation. ChR2-mCherry: P = 3.58 × 10⁻⁵, t = –9.24, d.f. = 7; mCherry: P = 0.55; t = –0.64, d.f. = 5 (**P < 0.01; ***P < 0.001; NS, P > 0.05; two-tailed paired samples t-test). j,l,n, Representative heat-maps tracing the animal position corresponding to the assays summarized in panels i, k and m, respectively. All shaded areas and error bars represent s.d., data are presented as mean ± s.d. A, anterior; D, dorsal; NS, not significant; OFT, open-field test; P, posterior; Stim., stimulation; V, ventral.

