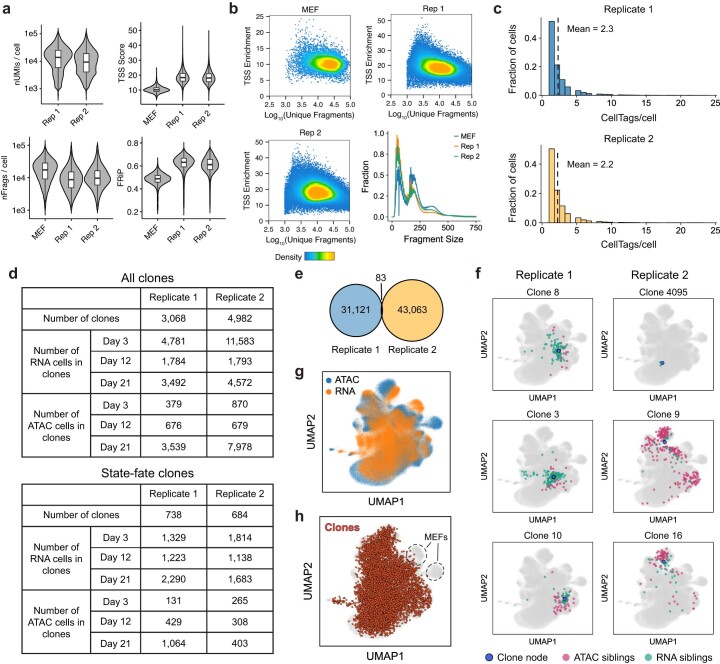
Extended Data Fig. 6. Single-cell metrics for the direct reprogramming dataset.
(a) Single-cell quality metrics for the scRNA-seq and scATAC-seq datasets, split by biological replicates. Cell numbers - MEF: 10,119; Rep 1: 92,261 (RNA) and 92,367 (ATAC); Rep 2: 123,827 (RNA) and 121,200 (ATAC). (b) Unique fragments/cell vs single-cell TSS enrichment scatterplots and fragment size distribution plots for the scATAC-seq dataset. (c) Histograms of number of CellTags detected per cell across the two biological replicates after filtering and processing of CellTag reads. (d) Summary of all clones identified across single-cell modalities, for both biological replicates. (e) Venn diagram showing overlap of CellTag signatures across the two biological replicates. (f) UMAPs depicting representative clone nodes from both biological replicates along with their constituent cells. (g) Cells in the clone-cell embedding UMAP with assay information projected shows uniform embedding of both single-cell modalities. (h) UMAP with all clone nodes highlighted shows uniform distribution of clones across all cell states except the unlabeled MEFs.

