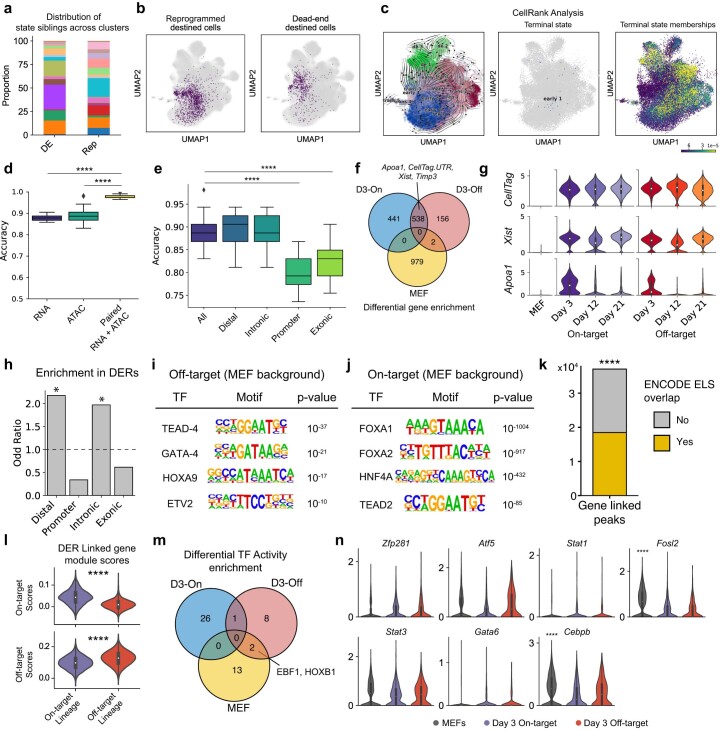
Extended Data Fig 8. Differential analysis of expression and chromatin accessibility state across lineages.
(a) Distribution of reprogramming and dead-end destined cells across clusters and (b) their projection on the clone-cell embedding UMAP. (c) CellRank fails to reveal true lineage dynamics underlying reprogramming. Velocity vectors overlaid onto the UMAP (left). ‘Early_1’, a cluster from Day 3 cells identified as a terminal state (middle). Continuous membership values for the terminal state ‘Early_1’ (right). (d) Fate prediction from Day 3 cell state using random forest classifiers. (Mann Whitney Wilcoxon test, two-sided; p-values: Paired vs ATAC = 3.5e-09; Paired vs RNA = 1.4e-09; n=25 accuracy values/boxplot). (e) State-fate prediction analysis using subsets of peaks (Mann Whitney Wilcoxon test, two-sided; p-values: All vs Promoter = 1.757e-08; All vs Exonic = 1.052e-07; n=25 accuracy values/boxplot). (f) Differentially enrichment genes across uninduced MEFs and the two fates on Day 3. (g) Violin plots for several genes enriched in both reprogramming fates on Day 3. (h) DERs are enriched in distal and intronic regions of the genome. (Fischer’s exact test, one-sided; p-values: 0 for both intronic and distal peaks). HOMER analysis to identify motifs enriched in (i) Off-target (dead-end) DERs and (j) On-target (reprogrammed) DERs, compared to a MEF DER background. (k) Enrichment of ENCODE cCRE Enhancer Like Elements in gene linked peaks. (Permutation test, one-sided; 10,000 permutations, p-value: 1e-04). (l) Enrichment of DER linked genes’ module scores in each lineage (Mann Whitney Wilcoxon test, two-sided; p-values: top = 6.2e-221; bottom = 0). (m) Differentially enriched TF activities across uninduced MEFs and the two reprogramming fates on Day 3. (n) Violin plots showing expression of off-target TFs, as identified from TF activity analysis, across uninduced MEFs and the two fates on Day 3. Cdx1 expression was not detected in any of the groups and is hence not plotted (Bonferroni corrected p-values: Cebpb = 1.64e-14, Fosl2 = 1.37e-39). All boxplots: center line, median; box limits, first and third quartiles; whiskers, 1.5x interquartile range. Panels g, l and n: Cell numbers – MEF: 10,526; Others – as indicated in Extended Data Fig. 6d.

