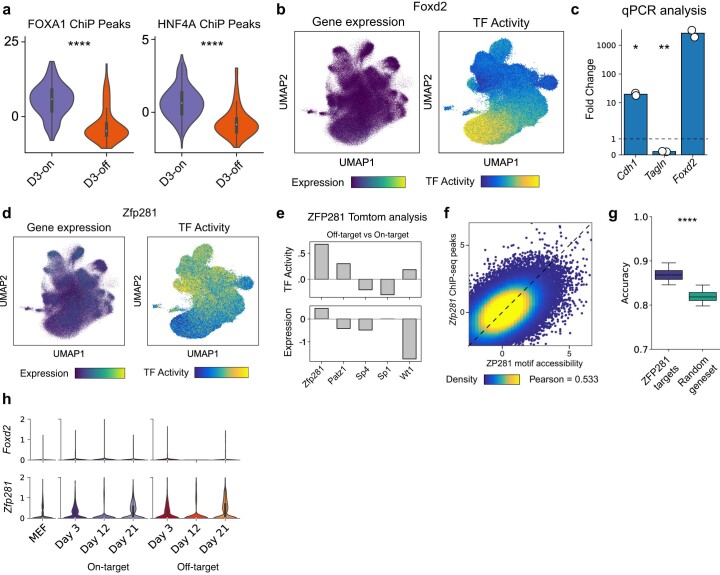
Extended Data Fig. 9. Identification of Zfp281 and Foxd2 as regulators of iEP reprogramming.
(a) Violin plots comparing accessibility z-scores of FOXA1 and HNF4A genomic binding sites across the two reprogramming fates on Day 3 (Mann Whitney Wilcoxon test, two-sided; p-value: FOXA1 = 1.159e-19, HNF4A = 2.2e-18) suggesting higher on-target binding of the two TFs in the on-target reprogramming lineage on Day 3. (b) Projection of Foxd2 gene expression and FOXD2 TF activity levels on the clone-cell embedding. (c) Bar plots showing fold-change in on-target and off-target marker genes (Cdh1 and Tagln respectively) upon Foxd2 over-expression, compared to a GFP control, on reprogramming day 12 (t-test; p-values: Tagln = 0.006, Cdh1 = 0.03; n=2 biological replicates). (d) Projection of Zfp281 gene expression and ZFP281 TF activity levels on the clone-cell embedding. (e) Tomtom analysis identified four dead-end enriched TFs with significantly similar motifs to ZFP281. ZFP281 shows the highest enrichment in dead-end cells for both gene expression and TF activity levels across all TF candidates. (f) Scatterplot showing correlation between single-cell accessibility of ZFP281 genomic binding sites and ZFP281 motifs (Pearson correlation coefficient = 0.533). (g) Boxplot showing significantly higher cell fate prediction accuracy using ZFP281 target genes (1,612 genes) compared to a size matched set of random genes (Mann Whitney Wilcoxon test, two-sided; p-value = 2.248e-09; n=25 accuracy values/boxplot). (h) Violin plots showing expression levels of Foxd2 and Zfp281 in uninduced MEFs and along the two lineages. All boxplots: center point: median; box limits: first and third quartiles; whiskers: upto 1.5x interquartile range. Panels a and h: Cell numbers – MEF: 10,526; Others – as indicated in Extended Data Fig. 6d.

