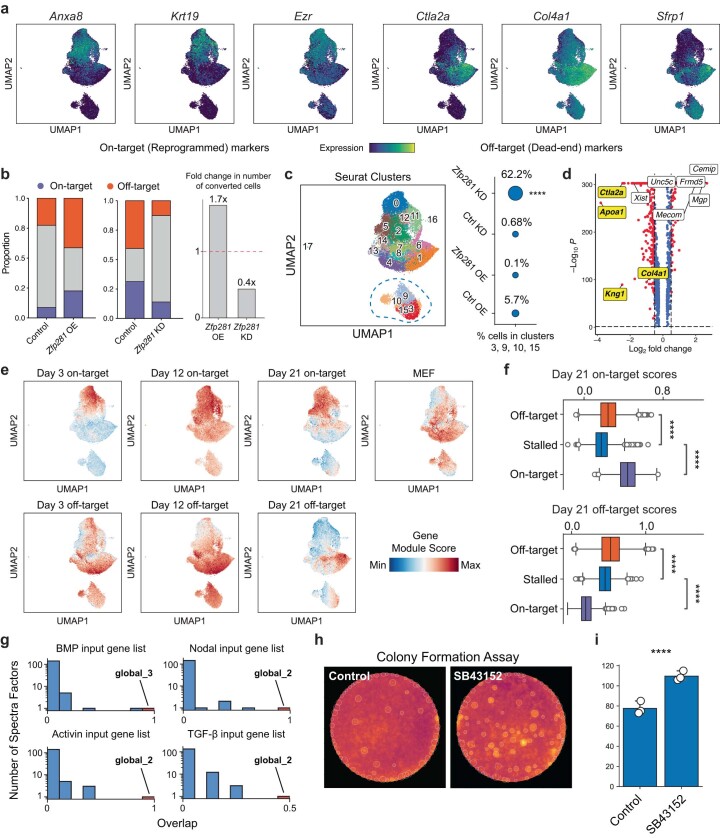
Extended Data Fig 10. Single-cell analysis of Zfp281 knockdown and overexpression.
(a) Projection of key on-target and off-target reprogramming marker genes on the UMAP for Zfp281 overexpression and knockdown cells. (b) (Left Panel) Bar plots showing proportion of on-target and off-target fate cells and (Right Panel) change in total number of reprogrammed cells across the KD and OE experiments. A positive correlation between rate of reprogramming and Zfp281 expression suggests a role for the TF in promoting fate conversion away from the starting MEF identity. (c) (Left Panel) UMAP highlighting a distinct sub-population of cells, likely representing a stalled reprogramming cell state. (Right Panel) Dot plot showing the proportion of each sample in the stalled clusters. Cells from the Zfp281 KD sample are enriched in the stalled cell states (Permutation test, one-sided; p-value = 0; 100,000 trials). (d) Volcano plot showing genes differentially enriched in the stalled cell sub-population (adjusted p-value < 0.05; Benjamini-Hochberg correction, absolute log2 fold-change > 0.5). (e) Gene expression module scores for MEF, on-target and off-target marker genes from all three time points, based on the lineage tracing experiment, projected on the UMAP. (f) Boxplots comparing module scores for Day 21 off-target, and Day 21 on-target marker genes module scores across stalled cells and the two reprogrammed clusters (Mann Whitney Wilcoxon test, two-sided; **** = p-value < 0.0001; Exact p-values in Supplementary Table 12; Cell numbers – Off-target: 7,069; On-target: 1,706; stalled: 4,726). Boxplots: center line, median; box limits, first and third quartiles; whiskers, 1.5x interquartile range. (g) Histograms showing overlap of all learned Spectra factors with each signaling pathway input gene list. BMP input list overlaps maximally with the ‘global_3’ factor (overlap = 1) while Activin, Nodal and TGF-β input lists overlap maximally with the ‘global_2’ factor (overlap = 1 for Activin and Nodal; overlap = 0.5 for TGF-β). (h) Representative images from the SB43152 colony formation assay; (i) Mean CDH1-positive colony counts in cells cultured in presence of SB43152 compared to a standard reprogramming experiment (t-test, two-sided; p-value = 2.26e-3; n = 3 biological replicates). Error bars represent 95% CI.

