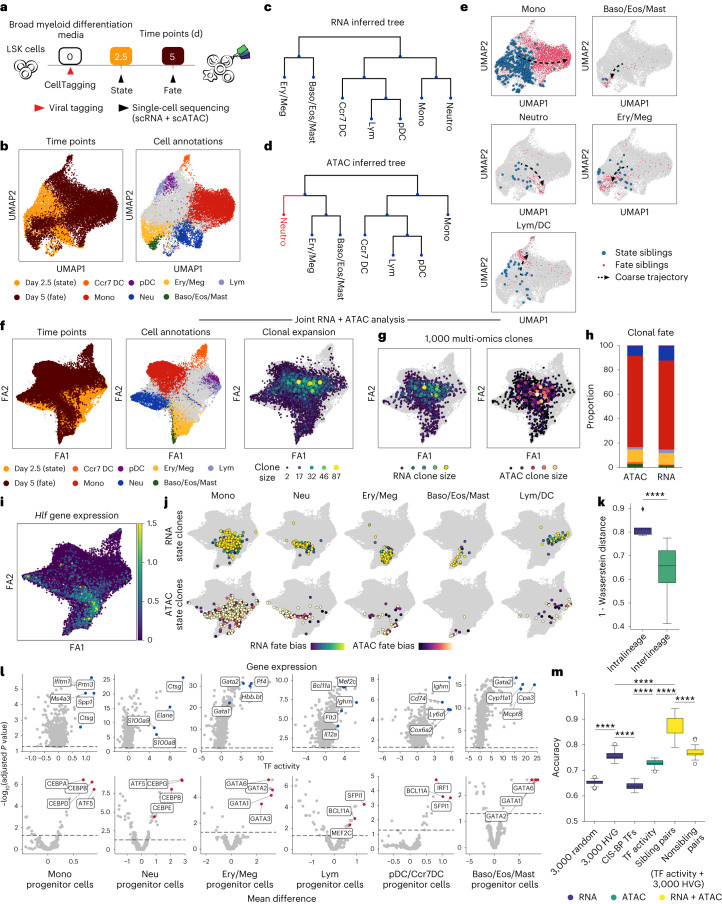
Fig. 2. Application of CellTag-multi to link early hematopoietic cell state with fate.
a, Schematic detailing the experimental design for the in vitro hematopoiesis state–fate experiment. b, scATAC-seq UMAPs with time point (left) and fate information (right) projected (Baso, Eos, Ery, Lym, Mast, Meg, Mono, Neu and pDC). Only major cell fates are highlighted. c,d, Hematopoietic fate hierarchy inferred from (c) scRNA or (d) scATAC clone coupling. e, scATAC-seq UMAPs with all state and fate siblings highlighted by fate. f, Clone-cell ForceAtlas (FA) embeddings with time point and fate projected onto cells (left and center) and clonal expansion information projected onto clones (right). g, FA embeddings with RNA and ATAC clonal expansion projected onto 1,000 multi-omic clones. Both modalities display expansion of early myeloid cells, consistent with our culture conditions. h, Bar plot of cell fates distribution across RNA and ATAC clones (fates colored as Fig. 2b). i, FA embedding with Hlf gene expression, a marker of hematopoietic stem and progenitor cells, projected onto the scRNA cells. j, FA embeddings with state (day 2.5) subclones highlighted for each major lineage along the differentiation continuum for both modalities and fate bias projected. k, Box plot comparing overlap between RNA and ATAC state subclones within and across cell fates (Mann–Whitney–Wilcoxon test, two-sided; P = 3.76 × 10⁻⁵; 5 intralineage and 20 interlineage comparisons). l, Volcano plots of differential feature enrichment analysis for each group of state subclones in scRNA (top) and scATAC (bottom). m, Box plot summarizing prediction accuracy values of trained state–fate prediction models. (Mann–Whitney–Wilcoxon test, two-sided; ****P < 0.0001, highly variable genes (HVG), n = 25 accuracy values for each model (Methods)). Boxplots, center line and median; box limits, first and third quartiles; whiskers, 1.5× interquartile range. Baso, basophils; Eos, eosinophils; Ery, erythroids; Lym, lymphoids; Mast, mast cells; Meg, megakaryocytes; Mono, monocytes; Neu, neutrophils; pDC: plasmacytoid dendritic cells.

