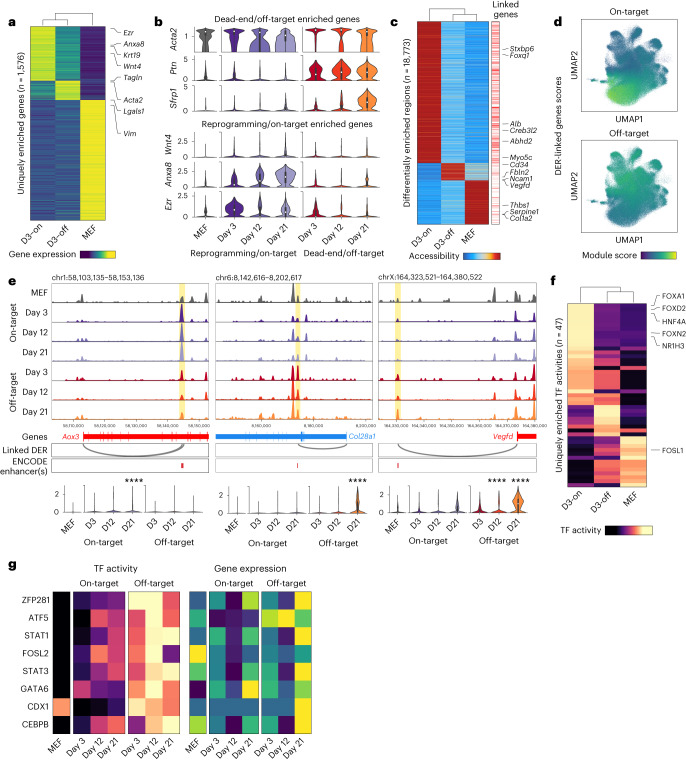
Fig. 4. Assessing fate-specific changes in early cell state.
a, Heatmap of genes uniquely enriched across uninduced MEFs or one of the two reprogramming fates on day 3 (false discovery rate (FDR) threshold = 0.05, log fold-change threshold = 0; D3-on: Day 3 on-target destined cells, D3-off: Day 3 off-target destined cells). b, Violin plots of several genes enriched in either off-target (dead-end) destined or on-target (reprogramming) destined cells. c, Heatmap of peaks uniquely enriched across uninduced MEFs or one of the two reprogramming fates on day 3 (FDR threshold = 0.05, log fold-change threshold = 1). Right, annotation of peaks linked to genes (Methods). d, Module scores for genes linked to either on-target or off-target DERs projected onto the clone-cell embedding. e, Top, accessibility browser tracks for each lineage split by day, highlighting peaks linked to late lineage markers (on-target: Aox3; off-target: Col28a1 and Vegfd) showing lineage-specific changes in accessibility on day 3. The Aox3- and Vegfd-linked DERs overlap perfectly with an ENCODE Enhancer-Like Signature (ELS) element, while the Col28a1-linked DER is within 100 bp of an ELS. Bottom, expression levels of the three genes across MEFs and the two reprogramming lineages split by days (Mann–Whitney–Wilcoxon test; two-sided; Bonferroni corrected ****P < 0.0001). f, Heatmap of TF activities uniquely enriched across uninduced MEFs or one of the two reprogramming fates on day 3 (FDR threshold = 0.05, mean difference threshold = 0.5). g, Heatmap showing TF activity (left) and gene expression (right) levels for off-target associated TFs in MEFs and each reprogramming lineage split by time points. TF activity scores show a much stronger lineage bias as compared to gene expression. Box plot definitions for b and e—center point, median; box limits, first and third quartiles; whiskers, up to 1.5× interquartile range; cell numbers—as indicated in Extended Data Fig. 6d.

