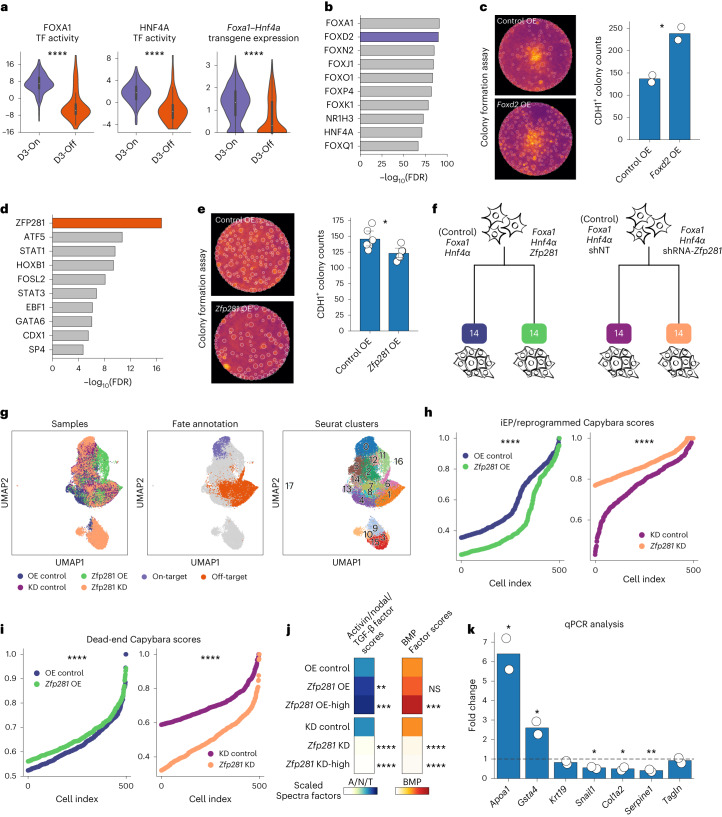
Fig. 5. Identification of TF regulators of on-target and off-target reprogramming fate.
a, Violin plots of FOXA1 and HNF4A TF activities and Hnf4α–Foxa1 transgene expression across the two fates on day 3 (Mann–Whitney-Wilcoxon test; two-sided; FOXA1 P = 1.2 × 10⁻²⁰, HNF4A P = 4.7 × 10⁻¹⁹, Hnf4α–Foxa1 P = 1.3 × 10−41; cell numbers—as indicated in Extended Data Fig. 6d). b, Top ten TF activities enriched in on-target destined cells. c, Representative images from the Foxd2 OE colony formation assay (CFA, left); mean CDH1+ colony counts in Foxd2 OE versus standard reprogramming (right, t-test, two-sided; *P = 0.025; n = 2 biological replicates). d, Top ten TF activities enriched in off-target destined cells. e, Representative images from the Zfp281 OE CFA (left); mean CDH1+colony counts in the Zfp281 OE versus standard reprogramming (right; t-test, two-sided; *P = 0.017; n = 6 biological replicates). f, scRNA-seq experiment schematic for Zfp281 OE and KD during reprogramming. g, UMAP for cells from Zfp281 OE and KD experiments; sample, cell fate and Seurat clusters projected. h,i, iEP identity scores (h) and dead-end identity scores (i) across the KD and OE samples compared to controls (Mann–Whitney–Wilcoxon test, two-sided; iEP: OE versus control, P = 1.07 × 10−53; KD versus control, P = 2.19 × 10−53; dead-end: OE versus control, P = 1.11 × 10⁻¹¹; KD versus control, P = 3.26 × 10−120). j, Activin/nodal/TGF and BMP spectra factor scores across control, OE and OE-high cells (top) and control, KD and KD-high cells (bottom). Mean scores are normalized relative to controls. OE-high cells: subset of OE cells with above average Zfp281 expression. KD-high cells: subset of KD cells with below average Zfp281 expression (Mann–Whitney–Wilcoxon test, two-sided; ****P < 0.0001; ***P < 0.001; **P < 0.01; NS = P > 0.05). k, Fold-change in reprogramming and dead-end marker genes expression during TGF-β signaling inhibition compared to control, on day 5 of reprogramming (t-test, two-sided; Apoa1, *P = 0.02, Col1a2, *P = 0.02, Gsta4, *P = 0.04, Serpine1, *P = 0.009, Snail1, *P = 0.01; n = 2 technical replicates). Bar plots: error bars: 95% CI. Boxplots—center point, median; box limits, first and third quartiles; whiskers, up to 1.5× interquartile range. CI, confidence interval.

