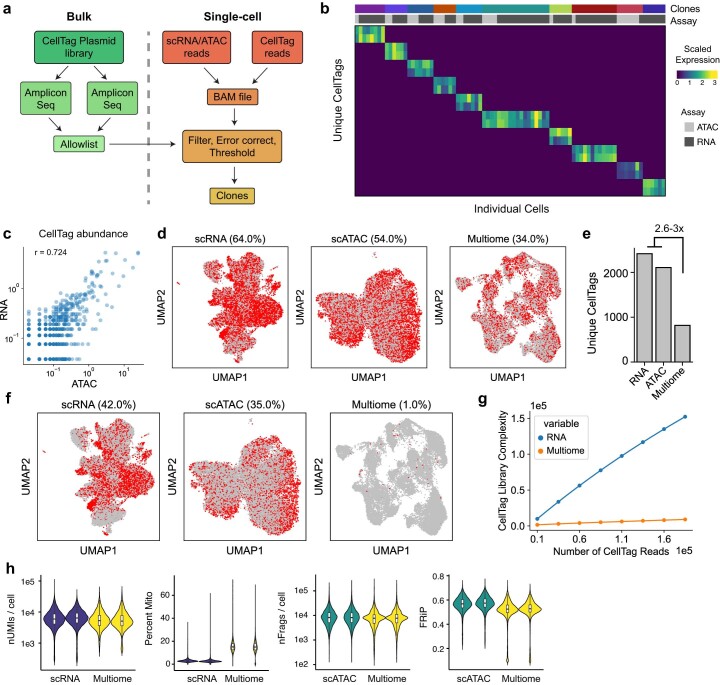
Extended Data Fig. 2. Testing CellTag-multi in cell lines and reprogramming fibroblasts.
(a) Schematic depicting the workflow for CellTag library allow listing and clone identification from single-cell CellTag reads. (b) Heatmap depicting scaled CellTag expression across ten clones in a population of expanded reprogramming fibroblasts. (c) Correlation between CellTag abundance across scRNA-seq and scATAC-seq cells from the reprogramming dataset (Pearson’s correlation coefficient = 0.724). (d) UMAPs for CellTagged, expanded, reprogrammed fibroblasts profiled with scRNA-seq, scATAC-seq and 10x Multiome with cells containing any CellTag reads highlighted. The percentage of cells with any detectable CellTag reads in each dataset are mentioned above respective UMAPs. (21,637 scRNA-seq, 20,466 scATAC-seq and 20,231 Multiome cells shown) (e) Bar plot showing a reduction in the total number of unique tags detected after quality filtering in the Multiome cells as compared to scRNA and scATAC cells. (f) UMAPs comparing number of cells with CellTags after error correction, allow listing and filtering (g) Line plot comparing library complexity for CellTag amplicon libraries across scRNA and Multiome datasets at different read depths (Methods). scATAC cells are excluded from this comparison as those do not contain any UMIs. (h) Violin plots depicting key scRNA-seq and scATAC-seq quality metrics for the single modality and multiome assays.

