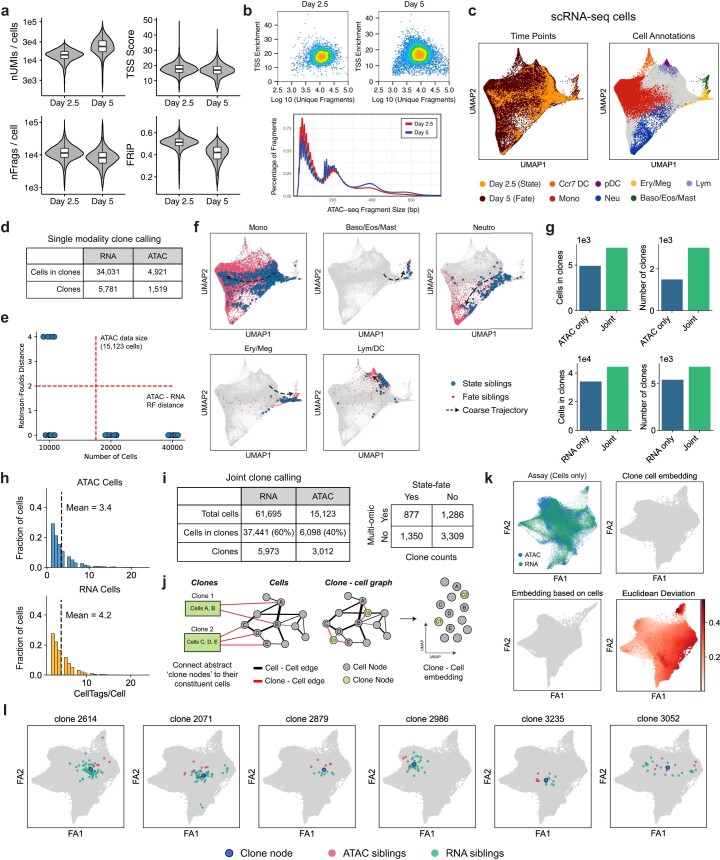
Extended Data Fig. 3. Single-cell metrics and cell annotation in hematopoiesis.
(a) Violin plots for single-cell quality metrics for the scRNA-seq and scATAC-seq data. Day 2.5: 5,161 (RNA) and 4,628 (ATAC) cells; Day 5: 56,534 (RNA) and 10,495 (ATAC) cells. (b) Unique fragments/cell vs single-cell TSS enrichment scatterplots and fragment size distribution plot for the two scATAC-seq time-points. (c) scRNA-seq UMAPs with time point (left panel) and cell fate information (right panel) projected. (d) Table summarizing clones identified in scRNA and scATAC datasets independently. (e) RNA fate hierarchy trees built with fewer cells are more discordant with the tree built using the full dataset (n=10 rounds of subsamplings for each indicated cell count). (f) scRNA-seq UMAPs with state and fate siblings for major hematopoietic fates highlighted. (g) Bar plots comparing number of clones and cells in clones across single-modality and joint modality clone calling. (h) Histograms of CellTags detected per cell across scRNA-seq and scATAC-seq datasets after filtering and processing of CellTag reads. (i) Tables summarizing all clones identified in the dataset. (j) Workflow for joint embedding of cells and clone nodes. (k) Top Left: Clone-cell embedding with RNA and ATAC assay information projected (cells only). Top Right and Bottom Left: Comparison of cell embeddings obtained using a conventional FA embedding vs a joint clone-cell graph-based embedding (only cell nodes shown, for direct comparison). Bottom Right: Clone-cell graph FA embedding with cells colored by deviation in their position between the two embeddings. (l) Visualization of clones along with their constituent cells confirms that clone nodes faithfully represent cells. Boxplots in a: center line: median; box limits: first and third quartiles; whiskers: up to 1.5x interquartile range.

