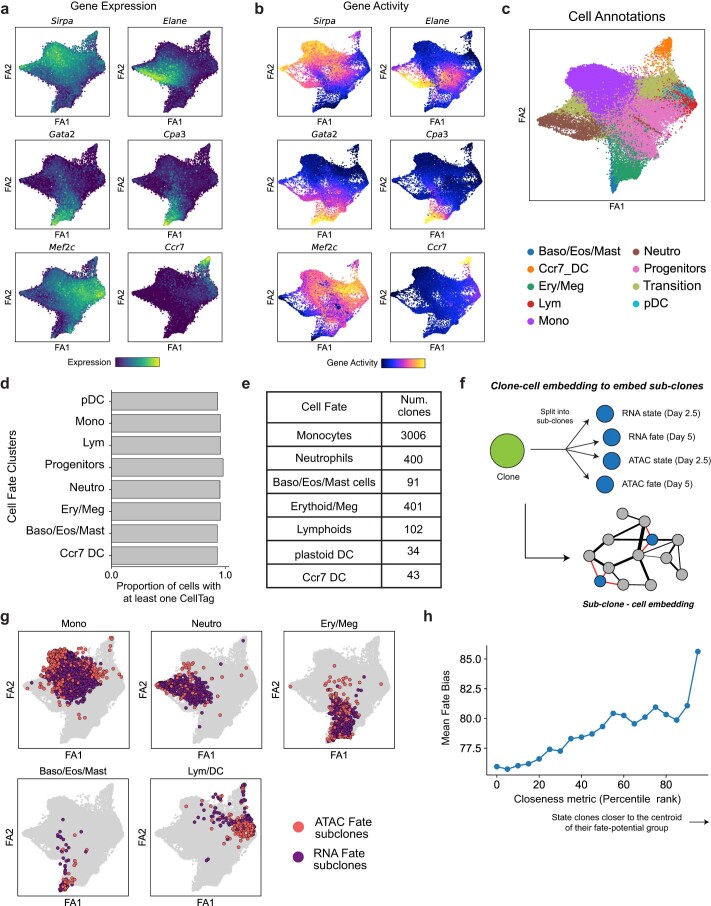
Extended Data Fig. 4. Fate annotation in hematopoiesis.
(a) Marker gene expression and (b) accessibility projected on the FA embedding for various hematopoietic cell fates. (c) FA embedding with the full set of cell annotations in the hematopoiesis dataset projected. (d) Bar plot summarizing proportion of cells with at least one detectable CellTag across major cell fate clusters. CellTags are profiled uniformly across all cell states. (e) Table summarizing number of clones identified in each fate. Clonal fate was annotated using the most dominant cell type amongst Day 5 fate siblings. (f) Schematic depicting joint embedding of sub-clones with cells using the clone-cell embedding method. (g) FA embedding with fate sub-clone nodes for major lineages highlighted. (h) Plot showing that fate bias increases from the periphery of each state group towards the center. The closeness metric is directly proportional to the closeness of a state sub-clone node to the centroid of its state group in a 30-dimensional UMAP space (Methods).

