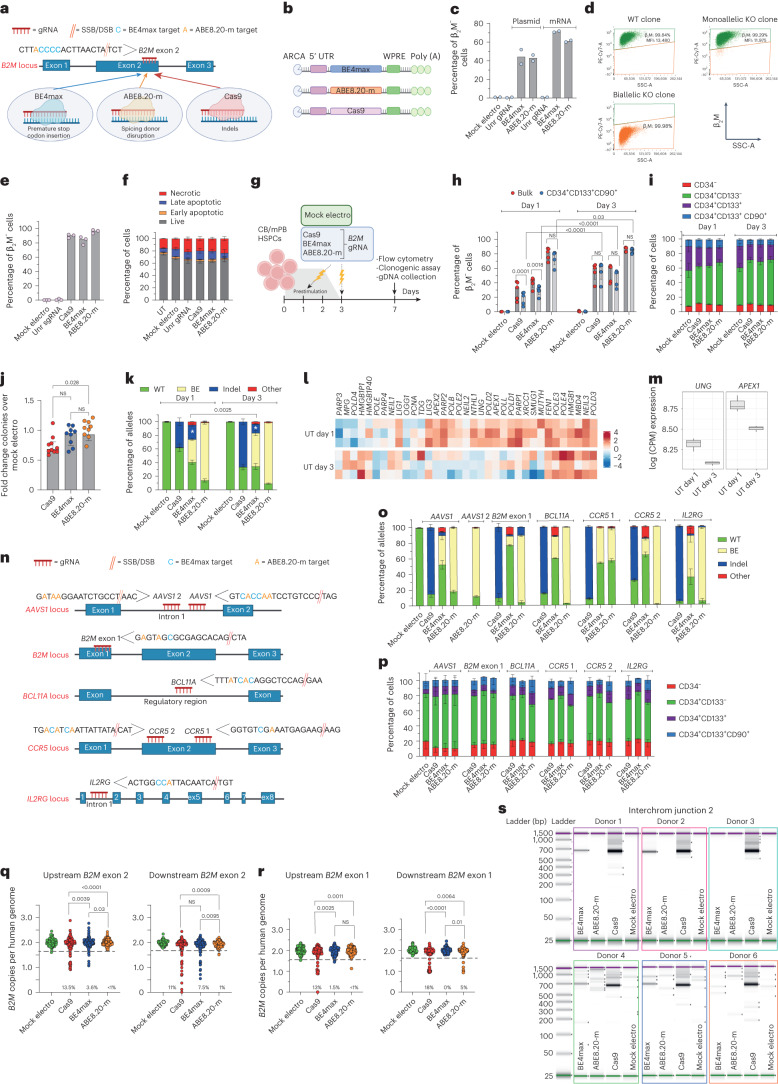
Fig. 1. Base editing of human HSPCs results in imprecise outcomes, including large deletions and translocations.
a,b, Schematic representation of the B2M exon 2 editing strategies and their cognate genetic outcomes (a) and the editor mRNAs (b); ARCA, anti-reverse cap analog; WPRE, woodchuck hepatitis virus post-transcriptional regulatory element. c, Percentage of β2M− B lymphoblastoid cells as measured by flow cytometry (n = 2). Data are shown as median values; Unr, unrelated; Mock electro, mock electroporated. d, Flow cytometry plots of three representative B lymphoblastoid clones showing wild-type (WT), monoallelic and biallelic editing confirmed by Sanger sequencing; SSC-A, side scatter; MFI, mean fluorescence intensity. e, Percentage of β2M− human T cells 7 d after treatments (n = 3). Data are shown as median values. f, Percentage of live, early/late apoptotic and necrotic T cells 24 h after treatments; UT, untreated (n = 3). Data are shown as mean ± s.e.m. g, Experimental workflow for B2M editing in CB or mPB HSPCs. h, Percentage of β2M− CB HSPCs edited at day 1 or day 3 after thawing (n = 5). Data are shown as median values with interquartile range (IQR) and were analyzed by a linear mixed effects (LME) model followed by post hoc analysis; NS, not significant. i, Proportion of cellular subpopulations within CB HSPCs from experiments in h (n = 5). Data are shown as mean ± s.e.m. and were analyzed by an LME model followed by post hoc analysis. j, Fold change in the number of colonies generated by CB or mPB HPSCs over mock electroporation (n = 10). Data are shown as median values with IQR and were analyzed by Kruskal–Wallis test with Dunn’s multiple comparison test. k, Percentage of B2M alleles measured by deep sequencing (WT or carrying the described editing outcomes in CB HSPCs; n = 5 for day 1; n = 6, 7, 7 and 7 for day 3). Data are shown as mean ± s.e.m. and were analyzed by Mann–Whitney test. Statistics is denoted by asterisks. l, Heat map of normalized read counts for genes belonging to the BER pathway (KEGG database hsa03410) in untreated CB HSPCs cultured for 1 or 3 d (n = 3). m, UNG and APEX1 log counts per million (CPM) reads in untreated CB HSPCs cultured for 1 or 3 d (n = 3). The center of the box plot represents the median, and boundaries represent first and third quartiles. Upper and lower whiskers extend 1.5× IQR from the hinge. n, Schematic representation of the AAVS1, B2M exon 1, BCL11A, CCR5 and IL2RG editing strategies. o, Percentage of AAVS1, B2M exon 1, BCL11A, CCR5 and IL2RG alleles measured by deep sequencing (WT or carrying the described editing outcomes in mPB HSPCs; n = 3 for AAVS1 Cas9; n = 7 for AAVS1 BE4max and ABE8.20-m; n = 3 for B2M exon 1, BCL11A, CCR5 and IL2RG). Data are shown as mean ± s.e.m. p, Proportion of cellular subpopulations within mPB HSPCs from experiments in o (n = 3). Data are shown as mean ± s.e.m. Samples edited in BCL11A, CCR5 and IL2RG were unified for statistical analysis using a Friedman test with Dunn’s multiple comparison on the most primitive compartments (CD34+CD133+ and CD34+CD133+CD90+), as experiments were performed in parallel on the same mPB HSPC donors. Cas9 and BE4max showed a significant reduction in the proportion of primitive compartments compared to ABE8.20-m (P = 0.016 and P < 0.0001, respectively). q, Copies of B2M sequences per human genome flanking the exon 2 target site in individual colonies generated by edited mPB HSPCs (n = 105, 188, 188 and 187 for the ‘upstream’ assay; n = 93, 188, 188 and 187 for the ‘downstream’ assay). Dashed lines indicate the lower limit of the confidence interval from mock-electroporated colonies. Data are shown as median values and were analyzed by Fisher’s exact test. r, Copies of B2M sequences per human genome flanking the exon 1 target site in individual colonies generated by edited mPB HSPCs (n = 89, 129, 130 and 125 for the ‘upstream’ assay; n = 89, 129, 129 and 126 for the ‘downstream’ assay). Dashed lines indicate the lower limit of the confidence interval from mock-electroporated colonies. Data are shown as median values and were analyzed by Fisher’s exact test. s, Images of capillary electropherograms showing amplification of interchromosomal (interchrom) junction 2 shown in Extended Data Fig. 1l after HSPC editing with two gRNAs targeting B2M exon 2 and AAVS1 in six mPB donors. All statistical tests are two tailed. n indicates biologically independent experiments except for q and r, in which n indicates independent samples.

