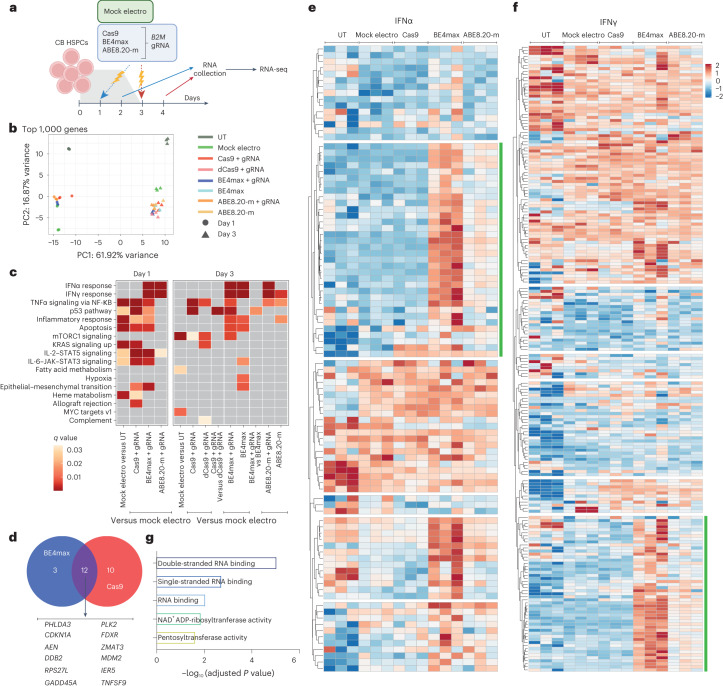
Fig. 2. BE mRNAs induce transcriptional responses in human HSPCs.
a, Experimental workflow for B2M exon 2 editing in a pool of six CB HSPC donors for transcriptomic analysis (n = 3 technical replicates for each condition). b, Principal component (PC) analysis from the RNA-seq dataset in a. c, Heat map of q values of enriched categories for selected comparisons between treatments on upregulated genes (false discovery rate (FDR) < 0.05 and log (fold change) > 0); dCas9, catalytically inactive (dead) Cas9. Data were analyzed by enrichment test. d, Venn diagram representing the number of p53 target genes upregulated after BE4max or Cas9 treatment. e,f, Heat maps of normalized read counts for target genes belonging to IFNα (e) and IFNγ (f) response categories across samples. Green lines indicate the subset of genes identified by unsupervised clustering with higher normalized read counts after BE treatments. g, Adjusted P values for the top five enriched categories (Hallmark gene set) when computing genes belonging to the green cluster from e and f. Data were analyzed by enrichment test. All statistical tests are two tailed. n indicates the number of independent samples.

