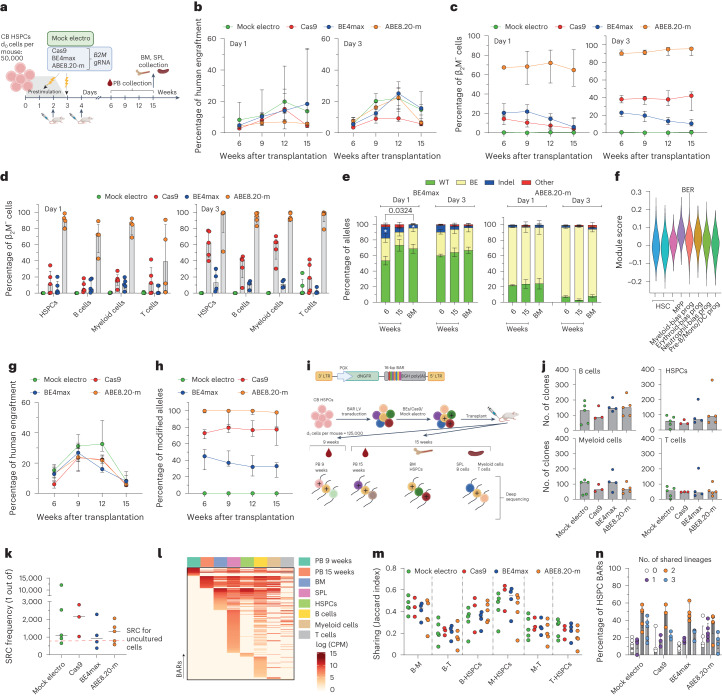
Fig. 3. Base editing preserves long-term multilineage repopulation capacity of HSPC clones.
a, Experimental workflow for B2M exon 2 editing in CB HSPCs and xenotransplantation. b,c, Percentage of human cell engraftment (b) and β2M− cells within human grafts (c) in mice transplanted with CB HSPCs after B2M exon 2 editing at day 1 (left; n = 5, 5, 5 and 4) or day 3 (right; n = 5, 5, 4 and 5) after thawing. Data are shown as median values with IQR and were analyzed by LME model followed by post hoc analysis. d, Percentage of β2M− cells within hematopoietic lineages from BM (HSPCs) and SPL (B cells, myeloid cells and T cells) from a (n = 5, 5, 5 and 4 for day 1; n = 5, 5, 4 and 5 for day 3). Data are shown as median with IQR. e, Percentage of B2M exon 2 alleles measured by deep sequencing (WT or carrying the described editing outcomes in mice from a; BE4max n = 5 for day 1, n = 4 for day 3; ABE8.20-m n = 4 day 1, n = 5 for day 3). Data are shown as mean ± s.e.m. and were analyzed by Kruskal–Wallis with Dunn’s multiple comparison. f, Module score for genes belonging to the BER pathway (KEGG database hsa03410) in different HSPC subsets from Schiroli et al.5; MPP, multipotent progenitors; prog, progenitors; Mono, monocyte; DC, dendritic cell; Pre-B, pre-B cell. g,h, Percentage of human cell engraftment (g) and modified AAVS1 alleles within human grafts (h) in mice transplanted with mPB HSPCs after AAVS1 editing at day 3 after thawing (n = 4, 4, 5 and 5). Data are shown as median with IQR and were analyzed by LME model followed by post hoc analysis. i, Schematic representation of the barcoded LV library (top) and the workflow for the CB HSPC clonal tracking experiment (bottom); LTR, long-terminal repeat; PGK, phosphoglycerate kinase promoter; BGH, bovine growth hormone polyadenylation signal. ‘+’ is used to graphically mark edited cells. j, Number of clones in hematopoietic lineages from mouse organs from i (n = 5, 3, 4 and 5). Data are shown as median values. k, Severe combined immunodeficient (SCID)-repopulating cell (SRC) frequency in mice from i, calculated by dividing the d0 equivalent cell number by the number of engrafted clones from BM in Extended Data Fig. 2p. The red line shows the SRCs for uncultured HSPCs29 (n = 5, 3, 4 and 5). Data are shown as median values. l, Heat map of the abundance (red-scaled palette) of BARs (rows) for one representative BE4max mouse in PB at the indicated times after transplant, hematopoietic organs and lineages (columns). m, Jaccard index as a measure of BAR sharing between B cells and myeloid cells (B-M); B and T cells (B-T); B cells and HSPCs (B-HSPCs); myeloid cells and HSPCs (M-HSPCs); myeloid and T cells (M-T); T cells and HSPCs (T-HSPCs) (n = 5, 3, 4 and 5). Data are shown as median values. n, Percentage of unique HSPC BARs shared with 0, 1, 2 or 3 hematopoietic lineages (n = 5, 3, 4 and 5). Data are shown as median values with IQR. All statistical tests are two tailed. n indicates independent animals.

