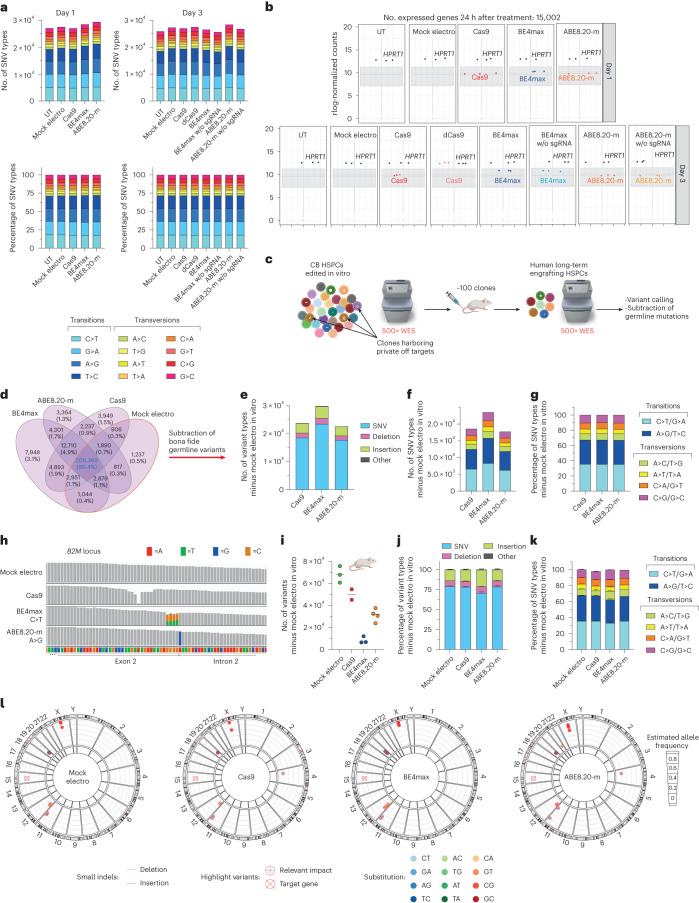
Fig. 4. Effects of base editing on the mutational landscape in HSPCs across the transcriptome and genome.
a, Number of SNV types (top) and their relative proportions (bottom) in RNA-seq experiments in Fig. 2a; w/o, without; sgRNA, single gRNA. b, Box plot showing the normalized expression (read counts) of the different editors and the HPRT1 housekeeping gene in RNA-seq experiments in Fig. 2a; rlog, regularized log. c, Schematic representation of the WES rationale and bioinformatic pipeline in CB HSPCs treated in vitro and retrieved from xenotransplanted mice in Fig. 3i. d, Venn diagrams representing variants shared among in vitro treated samples from e. e–g, Number of variants (e), number of SNV types (f) and their relative proportion (g) from in vitro samples from c obtained after subtraction of germline variants. h, Read alignments at B2M in the WES dataset from c. i–k, Number of variants (median; i), relative proportion of variants (mean ± s.e.m; j) and relative proportion of SNV types (mean ± s.e.m.; k) in the human xenograft from c obtained after subtraction of germline variants (n = 3, 2, 3 and 4). l, Circos plots representing variants in cancer-associated genes classified as high/moderate impact identified by WES in the human xenografts from c (n = 3, 2, 3 and 4). All statistical tests are two tailed. n indicates the number of independent samples for Fig. 1a,b and independent animals for i–l.

