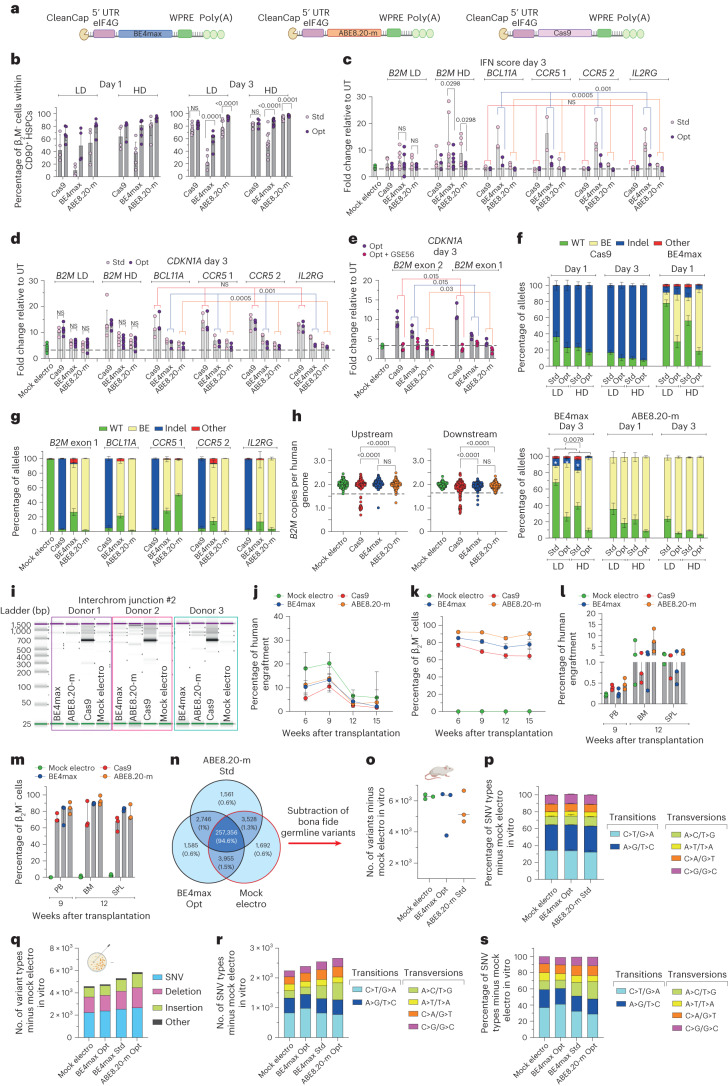
Fig. 5. Optimized BE mRNAs improved editing efficiency and precision at the target site, dampened cellular responses but perturbed the mutational landscape after increased expression.
a, Schematic representation of the optimized mRNAs. b, Percentage of β2M−CD34+CD133+CD90+ mPB HSPCs after editing at day 1 (left) or day 3 (right) after thawing and measured by flow cytometry; Std/Opt, standard/optimized; LD, low dose (3.5 μg); HD, high dose (7.5 μg; n = 4, 5, 4, 4, 4 and 5 for low dose day 1; n = 4, 4, 5, 6, 5 and 5 for high dose day 1; n = 8, 9, 6, 6, 8 and 9 for low dose day 3; n = 5, 5, 9, 10, 7 and 7 for high dose day 3). Data are shown as median with IQR and were analyzed by LME model followed by post hoc analysis. c, IFN score defined as the sum of fold change of IRF7, OAS1 and DDX58 expression over untreated samples 24 h after editing at day 3 after thawing (n = 9 for mock-electroporated samples; n = 4, 5, 6, 5, 5 and 5 for B2M low dose; n = 4, 5, 7, 7, 6 and 5 for B2M high dose; n = 3 for BCL11a, CCR5 and IL2RG). Data are shown as median values with IQR. For B2M low dose and high dose, data were analyzed by LME followed by post hoc analysis. For BCL11a, CCR5 and IL2RG, data were analyzed by Friedman test with a Dunn’s multiple comparison on unified samples. d, Fold change of CDKN1A expression over untreated samples 24 h after editing at day 3 after thawing (n = 11 for mock-electroporated samples; n = 5, 5, 6, 6, 6 and 6 for B2M low dose day 3; n = 5, 5, 7, 7, 7 and 7 for B2M high dose day 3; n = 3 for BCL11a, CCR5 and IL2RG). Data are shown as median values with IQR. For B2M low dose and high dose, data were analyzed by LME model followed by post hoc analysis. For BCL11A, CCR5 and IL2RG, data were analyzed by Friedman test with Dunn’s multiple comparison test on unified samples. e, Fold change of CDKN1A expression over untreated samples 24 h after editing at day 3 after thawing with optimized mRNA in the absence or presence of GSE56 (n = 3). Data are shown as median with IQR and were analyzed by Wilcoxon test on the B2M exon 1 and exon 2 unified samples. f, Percentage of B2M exon 2 edited alleles measured by deep sequencing (WT or carrying the described editing outcomes; n = 4). Data are shown as mean ± s.e.m. and were analyzed by Wilcoxon test performed on day 3 ‘Std’ versus ‘Opt’ groups unifying mRNA doses for statistical analysis. g, Percentage of B2M exon 1 (n = 4), BCL11A, CCR5 and IL2RG (n = 3) edited alleles measured by deep sequencing (WT or carrying the described editing outcomes). Data are shown as mean ± s.e.m. h, Copies of B2M sequences per human genome flanking the target site in individual colonies generated by edited mPB HSPCs using optimized mRNAs (n = 105, 186, 184 and 185 for the ‘upstream’ assay; n = 93, 188, 187 and 186 for the ‘downstream’ assay). Dashed lines indicate the lower limit of the confidence interval from mock-electroporated colonies. Data are shown as median with IQR and were analyzed by Fisher’s exact test. i, Images of capillary electropherogram showing amplification of interchromosomal junction 2 shown in Extended Data Fig. 1l after HSPC editing with two gRNAs targeting B2M exon 2 and AAVS1 in three mPB donors. j,k, Percentage of human cell engraftment (j) and percentage of β2M− cells within human grafts (k) in mice transplanted with mPB HSPCs edited at day 3 after thawing with optimized Cas9, BE4max and ABE8.20-m mRNAs at the lowest maximally effective dose (3.5, 7.5 and 3.5 µg, respectively; n = 6). Data are shown as median values with IQR and were analyzed by LME model followed by post hoc analysis. l,m, Percentage of human cell engraftment (l) and β2M− cells within human grafts (m) in secondary recipient mice from j (n = 3). Data are shown as median with range. n, Venn diagrams representing variants shared among in vitro treated samples from Extended Data Fig. 3k. o,p, Number of variants (median; o) and relative proportion of SNV types (mean ± s.e.m; p) in the human xenograft from Extended Data Fig. 3k obtained after subtraction of germline variants. q–s, Number of variants (q), number of SNV types (r) and their relative proportion (s) in the pool of colonies from Extended Data Fig. 3m obtained after subtraction of germline variants. All statistical tests are two tailed. n indicates biologically independent experiments except for h and q–s, in which n indicates independent samples, and j–p, in which n indicates independent animals.

