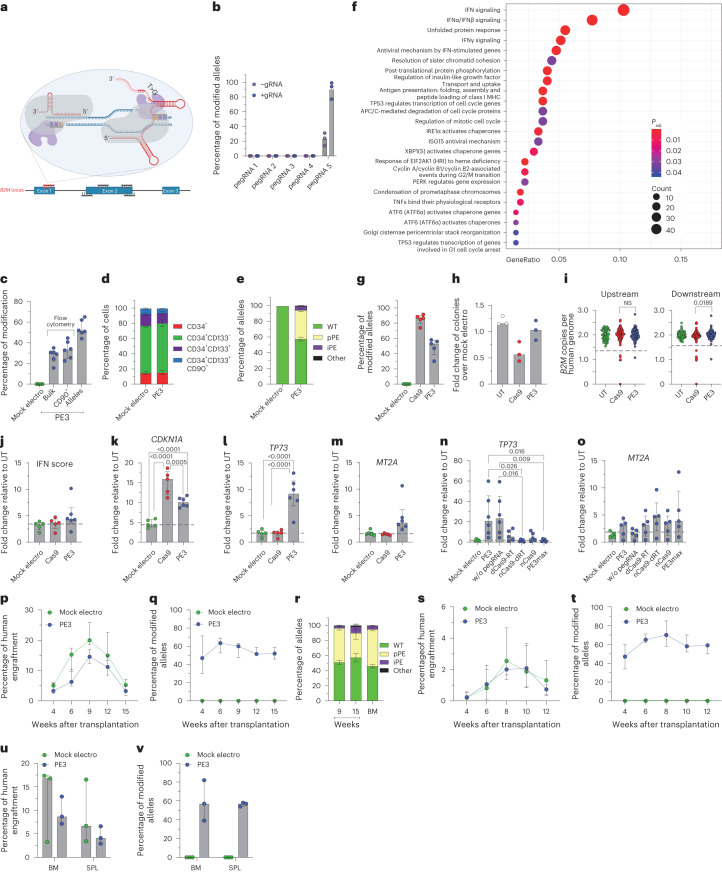
Fig. 6. Efficient prime editing in long-term repopulating HSPCs.
a, Schematic representation of the B2M prime editing screening. The selected pegRNA and gRNA are represented in red. b, Percentage of B2M prime-edited alleles in K-562 cells measured by Sanger sequencing 9 d after the editing procedure (n = 3). Data are shown as median values. c, Flow cytometry (bulk and CD90+) and molecular analysis of B2M modification 7 d after prime editing in human mPB HSPCs (n = 6). Data are shown as median values with IQR. d, Proportion of cell subpopulations within mPB HSPCs from experiments in c (n = 6). Data are shown as mean ± s.e.m. e, Percentage of B2M alleles measured by deep sequencing (WT or carrying precise prime editing (pPE), imprecise prime editing (iPE) or other modifications in mPB HSPCs; n = 6). Data are shown as mean ± s.e.m. f, Dot plot of adjusted P values of enriched categories on upregulated (FDR < 0.05 and log (fold change) > 0) genes for PE3 versus mock-electroporated HSPCs. Data were analyzed by enrichment test; Padj, adjusted P value; MHC, major histocompatibility complex. g, Percentage of B2M Cas9- or PE3-edited alleles 7 d after treatment of mPB HSPCs (n = 5). Data are shown as median values with IQR and were analyzed by Mann–Whitney test. h, Fold change in the number of colonies generated by mPB HPSCs over mock-electroporated cells (n = 3). Data are shown as median values. i, Copies of B2M sequences per human genome flanking the target site in individual colonies generated by edited mPB HSPCs (n = 70, 137 and 137 for the ‘upstream’ assay; n = 70, 137 and 139 for the ‘downstream’ assay). Dashed lines indicate the lower limit of the confidence interval from mock-electroporated colonies. Data are shown as median values with IQR and were analyzed by Fisher’s exact test. j, IFN score defined as the sum of fold change of IRF7, OAS1 and DDX58 expression over untreated 24 h after editing (n = 5, 5 and 6). Data are shown as median with IQR and were analyzed by LME followed by post hoc analysis. k–o, Fold change in expression of CDKN1A (n = 5, 5 and 6; k), TP73 (n = 5, 5 and 6; n = 5, 6, 6, 5, 5, 5 and 5; l) and MT2A (n = 5, 5 and 6; n = 5, 6, 6, 5, 5, 5 and 5; m) over that in untreated samples 24 h after editing (n = 5, 5 and 6). Data are shown as median values with IQR and were analyzed by LME model followed by post hoc analysis; dRT, catalytically inactive (dead) RT. p,q, Percentage of human cell engraftment (LME model followed by post hoc analysis; p) and percentage of modified B2M alleles within human grafts (o) in mice transplanted with mPB HSPCs edited at B2M following PE3 or mock electroporation (n = 5 and 6). Data are shown as median with IQR. r, Percentage of B2M alleles measured by deep sequencing (WT or carrying precise prime editing, imprecise prime editing or other modifications in PB and BM of mice from p; n = 6). Data are shown as mean ± s.e.m. s,t, Percentage of human cell engraftment (s) and percentage of modified B2M alleles within human grafts (t) in secondary recipient mice (n = 3). Data are shown as median values with ranges. u,v, Percentage of human cell engraftment (u) and modified B2M alleles (v) in BM and SPL of secondary recipient mice from s (n = 3). Data are shown as median values with ranges. All statistical tests are two tailed. n indicates biologically independent experiments except for i, in which n indicates independent samples, and p–v, in which n indicates independent animals.

