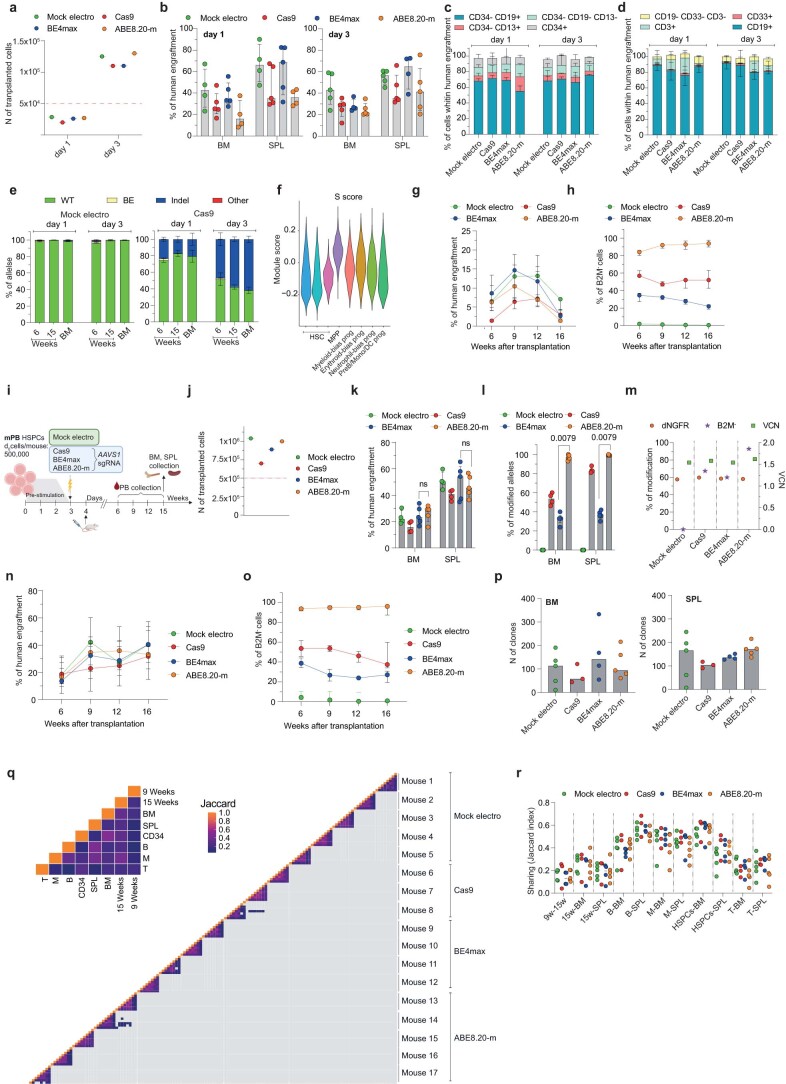
Extended Data Fig. 2. In vivo persistence of edited HSPCs.
a, Number of cells transplanted per mouse for experiment in Fig. 3a. The red line corresponds to the d0 equivalent. b-d, Percentage of human cells engraftment in BM and SPL (b; median with IQR) and their respective lineage composition (c,d; mean s.e.m) in mice from Fig. 3a (n = 5,5,5,4 for day 1; n = 5,5,4,5 for day 3). e, Percentage of B2M exon 2 alleles, measured by deep sequencing, being WT or carrying the described editing outcomes in mice from Fig. 3a (Mock electro n = 4 for day 1, n = 5 for day 3; Cas9 n = 5 day 1, n = 5 for day 3). Mean s.e.m. f, Module score for genes belonging to the S-phase signatures from64 in different HSPC subsets from5. g,h, Percentage of human cells engraftment (g) and B2M− cells within human graft (h) in mice transplanted with mPB HSPCs edited at B2M exon 2 at day 3 post-thawing (n = 4,5,6,5). Median with IQR. LME followed by post hoc analysis. i, Experimental workflow for AAVS1 editing in mPB HSPCs and xenotransplantation. j, Number of cells transplanted per mouse for experiment in ‘i’. The red line corresponds to the d0 equivalent. k,l, Percentage of human cells engraftment (k) and AAVS1 modified alleles (l) in BM and SPL from ‘i’ (n = 4,4,5,5). Median with IQR. Mann-Whitney test. m, Percentage of dNGFR+ and B2M− cells, measured by flow cytometry, and vector copy number (VCN), measured by ddPCR. n,o, Percentage of human cells engraftment (n) and B2M− cells within human graft (o) in mice from Fig. 3i (n = 5,3,4,5). Median with IQR. p, Number of clones in hematopoietic organs of mice from Fig. 3i (n = 5,3,4,5). Median. q, Heatmap showing the Jaccard index as a measure of inter- and intra-sample BAR sharing in mice from Fig. 3i. r, Jaccard index as a measure of BAR sharing between hematopoietic organs in mice from Fig. 3i (n = 5,3,4,5). Median. All statistical tests are two-tailed. n indicate independent animals.

