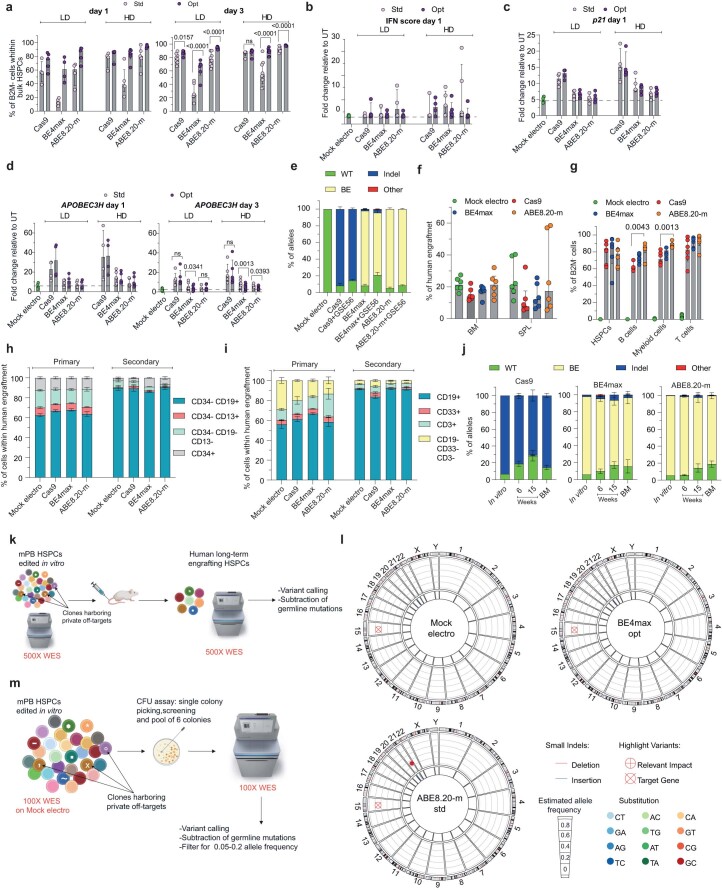
Extended Data Fig. 3. Impact of editors’ mRNA optimization on editing efficiency, cellular responses and precision at the target site and genome wide.
a, Percentage of B2M− HSPCs after editing at day 1 (left) or day 3 (right) post-thawing, measured by flow cytometry, from Fig. 5b (n = 4,5,4,4, 4,5 for LD day 1; n = 4,4,5,6,5,5 for HD day1; n = 8,9,6,6,8,9 for LD day 3; n = 5,5,9,10,7,7 for HD day 3). Median with IQR. LME followed by post hoc analysis. b, IFN score defined as sum of fold change of IRF7, OAS1 and DDX58 expression over UT 24 hrs after editing at day 1 post-thawing (n = 3 for Mock electro; n = 3,4,4,4,4,4 for LD; n = 3,4,5,5,5,5 for HD. Median with IQR. c, Fold change of p21 expression over UT 24 h after editing at day 1 post-thawing (n = 4 for Mock electro; n = 4 for LD; n = 4,4,5,5,4,5 for HD). Median with IQR. d, Fold change of APOBEC3H expression over UT 24 h after editing at day1 (left) and day 3 (right) post-thawing (n = 4 for Mock electro day 1; n = 4 for LD day 1; n = 4,4,5,5,5,5 for HD day 1; n = 8 for Mock electro day 3; n = 5,5,6,6,6,6 for LD day 3; n = 5,5,7,7,7,7 for HD day 3). Median with IQR. LME followed by post hoc analysis. e, Percentage of B2M exon 2 edited alleles, measured by deep sequencing, being WT or carrying the described editing outcomes (n = 3). Mean ± s.e.m. f,g, Percentage of human cells engraftment (f) and B2M− cells within hematopoietic lineages (g) in BM and SPL in mice form Fig. 5j (n = 6). Median with IQR. Kruskal-Wallis with Dunn’s multiple comparison. h,i, Lineage composition in BM (h) and SPL (i) in mice from Fig. 5j and Fig. 5l (n = 6,6,6,6,3,3,3,3). Mean ± s.e.m. j, Percentage of B2M exon 2 alleles, measured by deep sequencing, being WT or carrying the described editing outcomes in mice from Fig. 5j and in the in vitro outgrowth (In vitro: n = 1; Cas9: n = 5; BE4max: n = 6; ABE8.20-m: n = 6). Mean ± s.e.m. k, Schematic representation of the WES rationale and bioinformatic pipeline in mPB HSPCs treated in vitro and retrieved from xenotransplanted mice. l, Circos plots representing variants in cancer associated genes classified as high/moderate impact identified by WES by WES in the human xenograft from k. m, Schematic representation of the WES rationale and bioinformatic pipeline in mPB HSPCs treated in vitro and retrieved from pool of individual colonies. All statistical tests are two-tailed. n indicate biologically independent experiments except for Extended Data Fig. 3e–l in which n indicate independent animals and Extended Data Fig. 3m in which n indicate independent samples.

