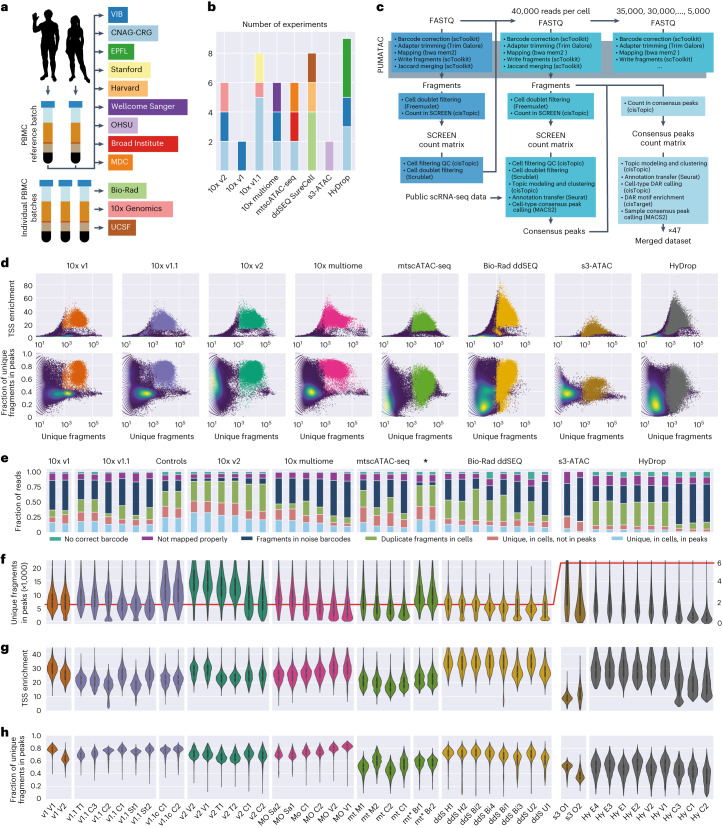
Fig. 1. Overview of experimental design and low-level quality control metrics.
a, Schematic overview of the experimental design; CNAG-CRG, Centro Nacional de Análisis Genómico; EPFL, École Polytechnique Fédérale de Lausanne; OHSU, Oregon Health & Science University; MDC, Max Delbrück Center for Molecular Medicine in the Helmholtz Association; UCSF, University of California San Francisco; VIB, Vlaams Instituut voor Biotechnologie. b, Bar chart of the number of experiments performed per technology colored by institute of origin. c, Diagram of the universal PUMATAC data analysis pipeline and further downstream analyses; QC, quality control. d, Distribution of TSS enrichment, FRIP and total unique fragment counts for all barcodes across all technologies. The blue, green and yellow color scale denotes local density. Saturated colors mark barcodes identified as cells. The distributions for individual samples are shown in Extended Data Fig. 2. e, Stacked bar plot showing the fraction of reads lost across each step of data processing. ‘Unique, in cells, in peaks’ is the final fraction of sequencing reads retained in count matrices. Asterisk among technology names indicates mtscATAC-seq samples performed on PBMC that were viability FAC-sorted prior to tagmentation. f–h, Distributions of unique fragments in peaks (f), TSS enrichment (g) and fraction of unique fragments in peaks (h) in filtered cell barcodes. The scale was shifted to accommodate lower fragment counts in s3-ATAC and HyDrop, indicated by a red line denoting a value of 6,000; n = 178,453 cells (before doublet filtering) examined over 47 independent experiments. Median values are indicated by central white dots, quartiles are indicated by black boxes, and minima/maxima/centers are not indicated.

