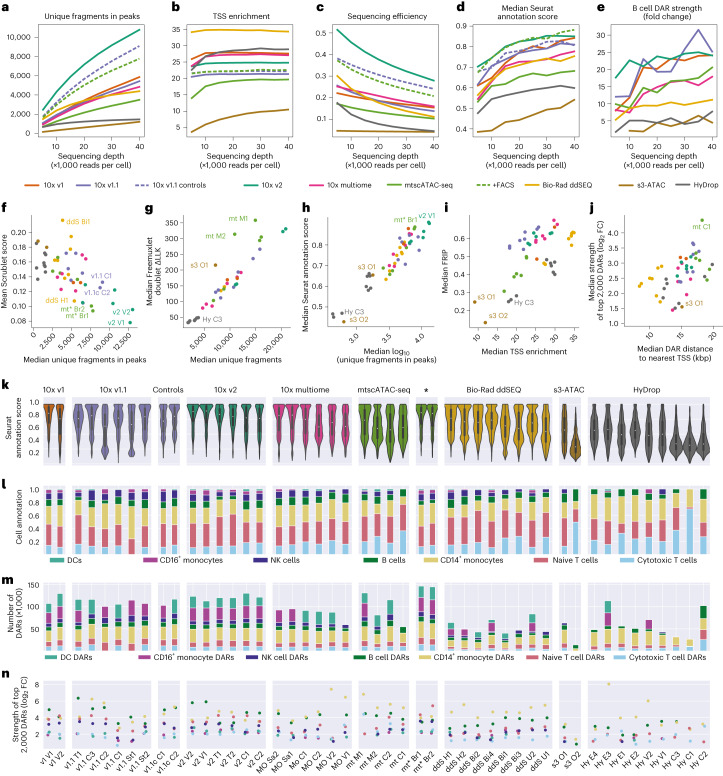
Fig. 2. Differences in automated cell-type annotation accuracy and differential region calling between techniques.
a–e, Line graphs showing the effect of sequencing depth (×1,000 reads per cell) on unique fragments in peak regions (a), TSS enrichment (b), sequencing efficiency (fraction of reads that are associated with filtered cells, not duplicated and located within a peak region; c), median Seurat label transfer score (d) and fold change enrichment of B cell DARs (e). f, Scatter plot of mean Scrublet score and median unique number of fragments in peaks across cells. g, Scatter plot of the median LLK (log likelihood) of Freemuxlet’s per cell doublet classification and median unique number of fragments across cells. h, Scatter plot of median Seurat score and median log10 of unique fragments in peaks in cells. i, Scatter plot of median FRIP and median TSS enrichment across cells in each sample. j, Scatter plot of log2 (fold change) (log2 (FC)) enrichment of the top 2,000 DARs across cell types and median distance of DARs to the nearest TSS (bp). Sample s3 O2 is omitted due to it being an outlier with a median distance of >300,000 bp; kbp, kilobase pairs. In f–j, each point represents one experiment, and points are colored by technique. k, Distributions of Seurat scores across samples. l, Fraction of cell types recovered in cells from individual samples; n = 169,156 cells (after doublet filtering) examined over 47 independent experiments. Median values are indicated by central white dots, quartiles are indicated by black boxes, and minima/maxima/centers are not indicated. m, Number of DARs recovered per cell type across samples. n, log2 (fold change enrichment) of the top 2,000 DARs colored by cell type.

