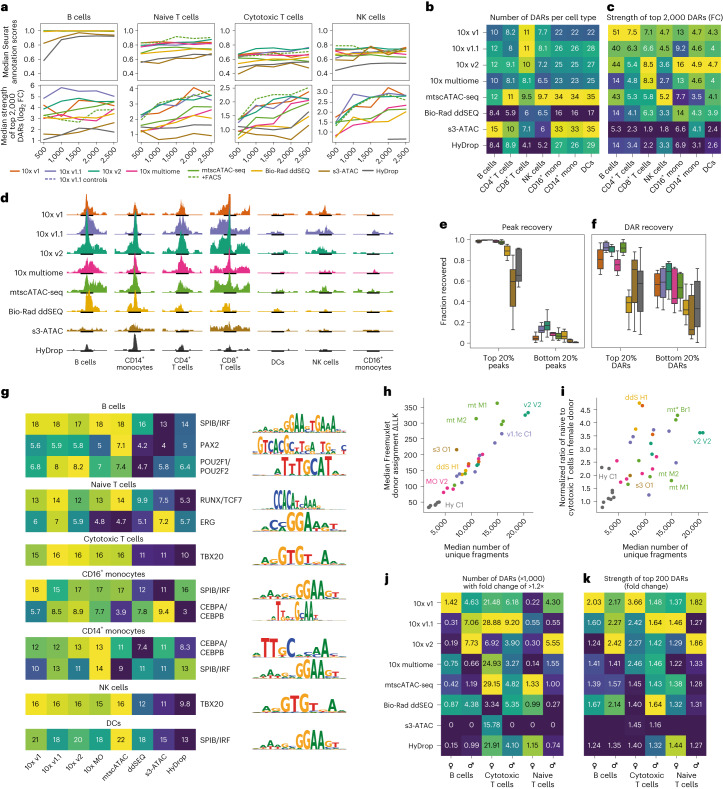
Fig. 3. Performance differences in detection of motif enrichment and sexual dimorphisms.
a, Dependency of Seurat label transfer scores and average log2 (fold change) of the top 2,000 DARs in selected cell types on the total number of cells in selected cell types. b,c, Heat map of the number of DARs (b) and heat map of the fold change enrichment (c) of the top 2,000 DARs sourced from the cell-type fair merged sets for every technique across cell types. Colors are scaled per column; mono, monocytes. d, Fragment coverage within each cell type’s strongest common DAR found in the merged set. Each cell type contains an equal number of cells across technologies. All tracks are scaled to the same absolute coverage. The 10x v1 track is slightly truncated to accommodate j. e,f, Fraction of the top 20% and bottom 20% peaks and DARs found by the merged cell-type fair set recovered in subsets from individual technologies. g, Heat map of the normalized enrichment score of cell-type-specific transcription factor motifs. Colors are scaled per row. h, Scatter plot of median Freemuxlet donor assignment log likelihood difference to second-best guess and median number of unique fragments. i, Scatter plot of the ratio of naive T cells to cytotoxic T cells in male and female subpopulations and median number of unique fragments. In h and i, each point represents one experiment, and points are colored by technique. j, Heat map of the number of sex-specific DARs. Colors are scaled per column. k, Heat map of fold change enrichment of the 200 strongest sex-specific DARs. Colors are scaled per column.

