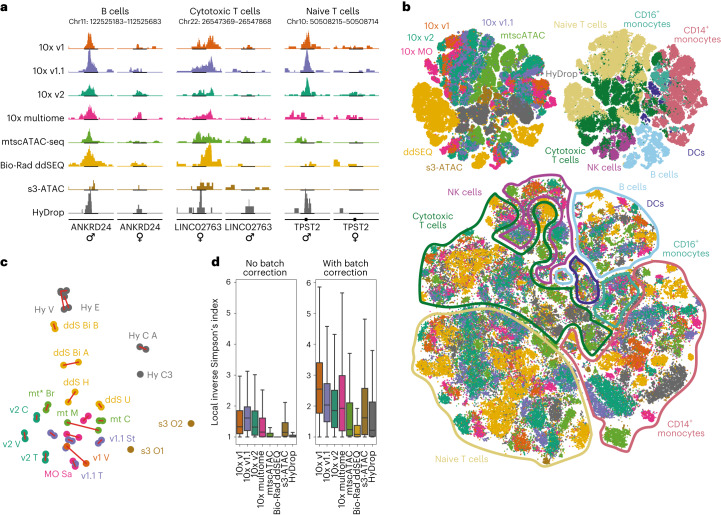
Fig. 4. Overview of the merged dataset.
a, Genome tracks of sex-specific DARs in B cells and cytotoxic and naive T cells showing coverage in male and female subpopulations. Coverage uses a common scale across techniques within each cell type and is cell count normalized (cell counts are equal for each sex within techniques); Chr, chromosome. b, Top, t-distributed stochastic neighbor embedding (t-SNE) projection of all 167,000 filtered cells across all 47 experiments colored by technology and cell type. Bottom, batch-corrected t-SNE using technology of origin as the batch variable. Data points were randomly shuffled before plotting. c, First two principal components of all experiments based on 15 basic quality metrics. Red links indicate same day replicate experiments. Caption denotes technique followed by center of sample origin (B for BioRad, Br for Broad, C for CNAG-CRG, E for EPFL, H for Harvard, M for MDC, O for OHSU, Sa for Sanger, St for Stanford, T for 10x Genomics, U for UCSF, and V for VIB), and finally an index (either A or B) to denote the replicate set if more than one set of replicates was performed at the same center. d, Local inverse Simpson index values before and after Harmony batch correction.

