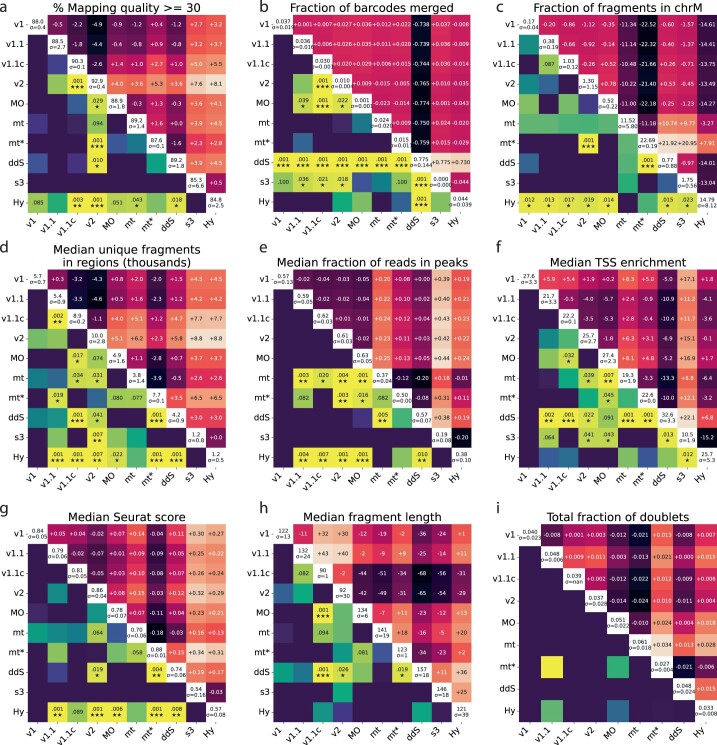
Extended Data Fig. 1. Games-Howell heatmaps of several quality control metrics.
Diagonal shows mean values across samples from each technology. Upper triangle shows pairwise differences between means. Lower triangle indicates significance of expected pairwise differences. mt* indicates FAC sorting for these mtscATAC-seq samples. a, % of all reads with Phred mapping quality score >= 30. b, Fraction of barcodes being the result of a Jaccard merging event (= being a barcode multiplet). c, Fraction of fragments aligned to mitochondrial genome. Figures d-g are cell-level statistics, meaning first a median is taken within each sample’s cells, and these medians are compared between techniques. d, Median unique fragments in peaks, in cells (x1000). e, Median fraction of reads in peaks in cells. f, Median TSS enrichments of reads within cells. g, Median Seurat scores across cells. h, Median fragment length in fragments files. i, Total number of doublets (both Freemuxlet + Scrublet-identified) filtered out, expressed as a fraction of total cells before doublet filtering.

