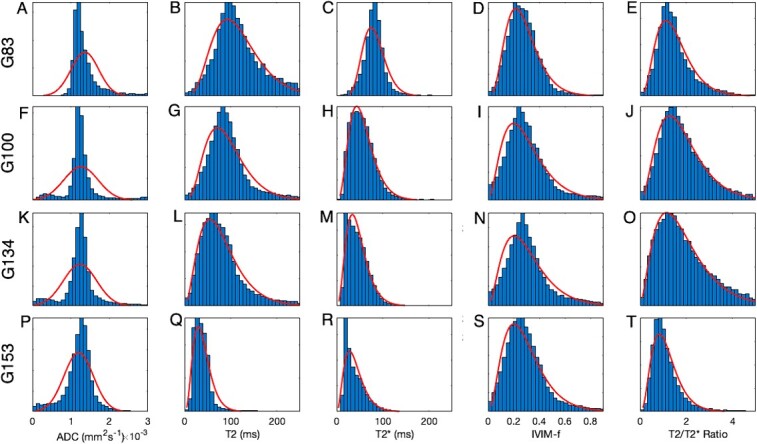
Figure 5.

Comparison of quantitative mapping from MRI for whole placenta properties. The four rows correspond to gestational age at MRI: A-E 83 days, F-J 100 days, K-O 134 days, P-T 153 days. Results of normal and gamma distributions for fitting are shown overlaid.
