Figure 8.

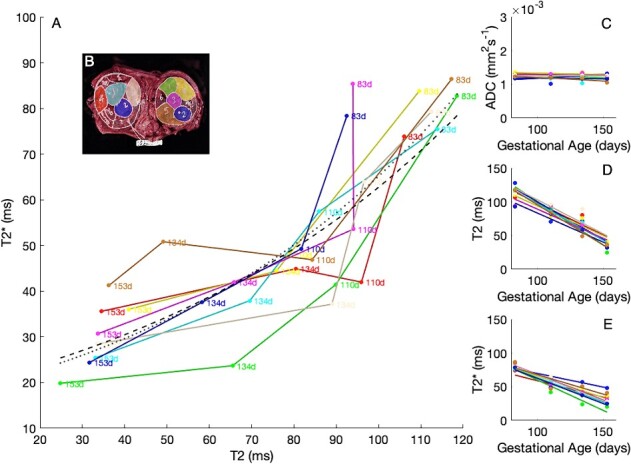
A) Variation of T2 and T2* with gestational age. Inset panels (C–E) show the independent parameter maps for ADC, T2, and T2*. Color-coding corresponds with cotyledon position in Figure 8B.

A) Variation of T2 and T2* with gestational age. Inset panels (C–E) show the independent parameter maps for ADC, T2, and T2*. Color-coding corresponds with cotyledon position in Figure 8B.