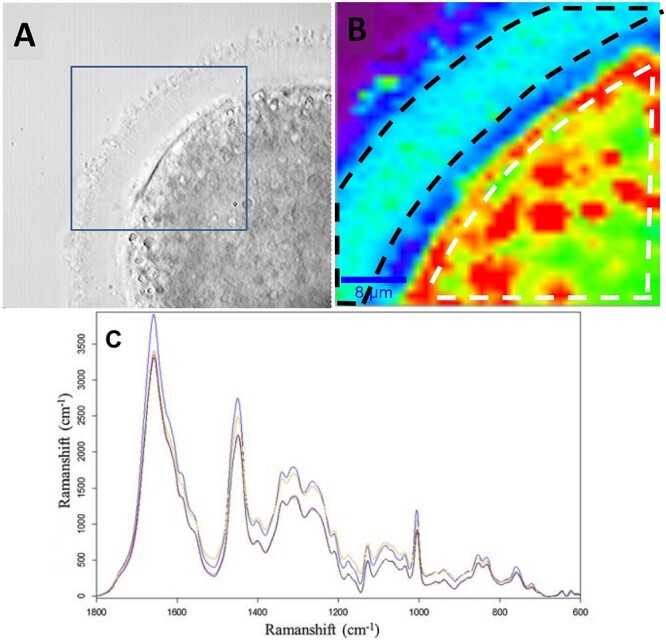
Figure 3.

Images from a control oocyte obtained from brightfield and Raman imaging (top). (A) Brightfield image of an oocyte. The square represents the portion imaged via Raman. (B) Raman image of oocyte from (A). The white dashed line measures the area used for the average spectrum of the cytoplasmic region of the oocyte. The black dashed line represents the area used to measure spectra of the ZP [63]. (C) Average Raman spectra of young oocytes (blue), in-vitro aged (black), oxidative damaged (pink), and old (yellow). The spectra demonstrate a molecular fingerprint of macromolecular components [56].
