Fig. 1.

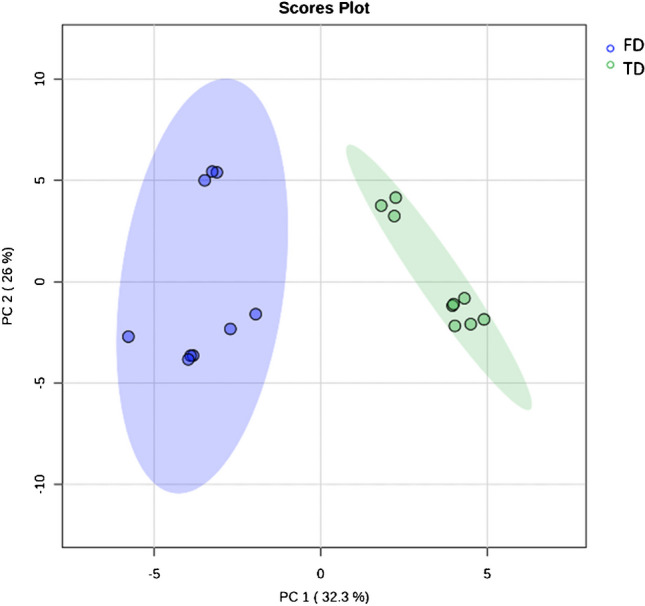
PCA score plot (PC1 and PC2) of overall metabolites profile (VOCs and cannabinoids) with 95% confidence interval, showing a variation between “tray drying” (TD, green area) and “freeze drying” (FD, light blue area)

PCA score plot (PC1 and PC2) of overall metabolites profile (VOCs and cannabinoids) with 95% confidence interval, showing a variation between “tray drying” (TD, green area) and “freeze drying” (FD, light blue area)