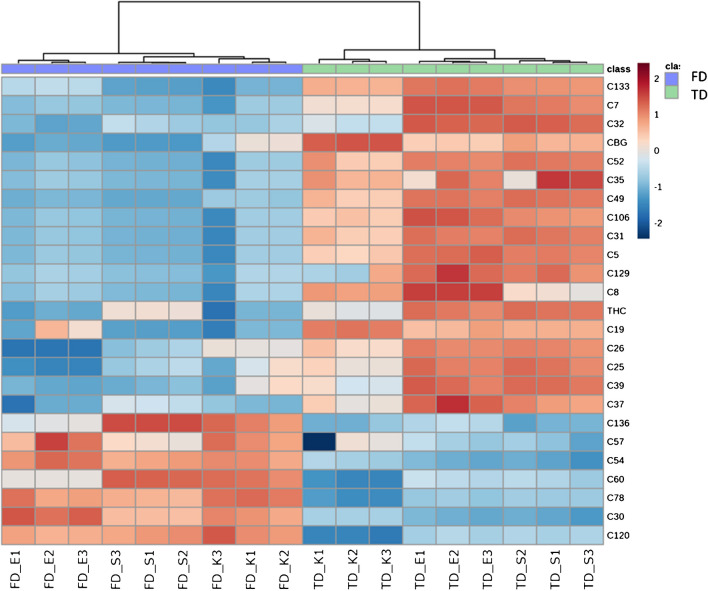
Fig. 3.
Hierarchical cluster analysis relative to cannabis inflorescences drying procedures FD and TD showing the top 25 most affected metabolites deriving from volcano plot analysis. Each coloured cell on the map corresponds to the relative measure of each metabolite (column normalised) after Log10 transformation to make metabolite intensity comparable. Cells in red show higher intensity, while those in blue refer to lower intensity. Sample codes refer to: freeze drying (FD), tray drying (TD); cannabis varieties Eletta Campana (E), Silvana (S), and Kompolti (K). The numbers 1, 2, and 3 refer to the biological sample

