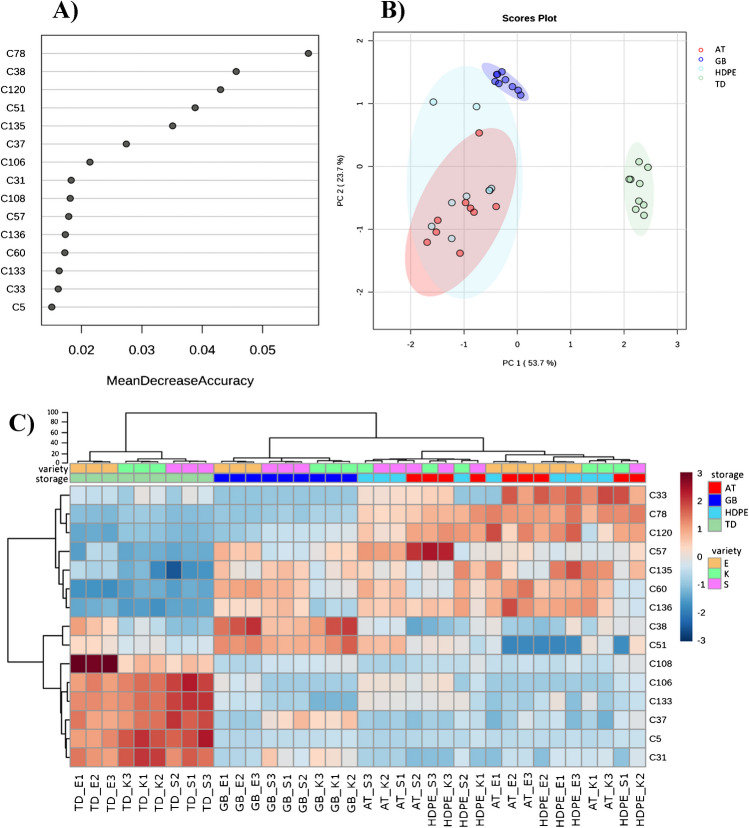
Fig. 5.
Results from random forest (RF) treatment classification based on VOCs. A Mean decrease accuracy analysis with VOCs ranched by their contribution to classification accuracy. B Principal component (PC) plots from PC analysis (PCA) based on RF VOCs of TD, GB, AT, and HDPE. Each ellipse represents the 95% confidence interval. The plots use PC1 and PC2 with a percentage of explained variance of 77.4%. C Heatmap and hierarchical clustering analysis obtained using the top discriminatory VOCs obtained with RF of the entire set of samples (see Table S1 compound names in italics). Sample codes refer to (i) tray drying (TD); (ii) airtight box made of high-density polyethylene (HDPE), (iii) open to air dry tray (AT), (iv) lid tight brown glass bottle (GB), (v) Eletta Campana (E), (vi) Kompolti (K), (vii) Silvana. The numbers 1, 2, and 3 refer to the biological sample. Blue to red colour on cells indicates low to high VOC abundance

