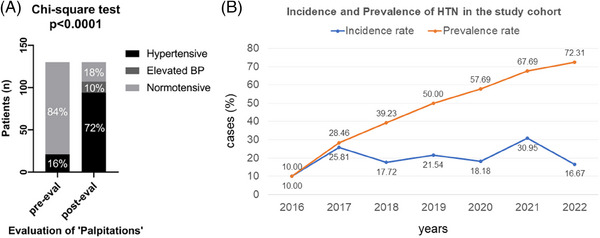
FIGURE 1.

Incidence and prevalence of hypertension over the study period: (A) bar graph depicting the prevalence of hypertension pre‐ and post‐palpitations evaluation. Note a 4.5‐fold increase in hypertension prevalence over the study period of 2.2 (0.7–4.1) years. (B) Graph showing the incidence and prevalence of hypertension in the study cohort between 2016 and 2022.
