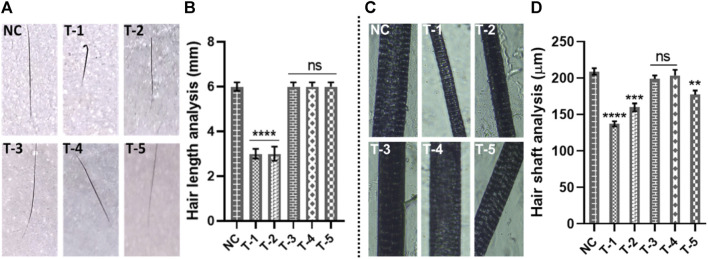
FIGURE 3.
Gross analysis of hair: (A) digital photographs of hair length, (B) hair length analysis of skin sections from different treatment groups. Results are presented as n = 60 + SD; ****p ≤ 0.0001 denotes NC versus T-1 and T-2; ns p > 0.05. (C) Photographs of hair shafts from different treatment groups. (D) Hair shaft analysis of skin sections from different treatment groups. Results are presented as n = 60 + SD; ****p ≤ 0.0001 denotes NC versus T-1; ***p ≤ 0.001 NC versus T-2; **p ≤ 0.01 denotes NC versus T-5; and ns p > 0.05 denoted NC versus T-3 and T-4.

