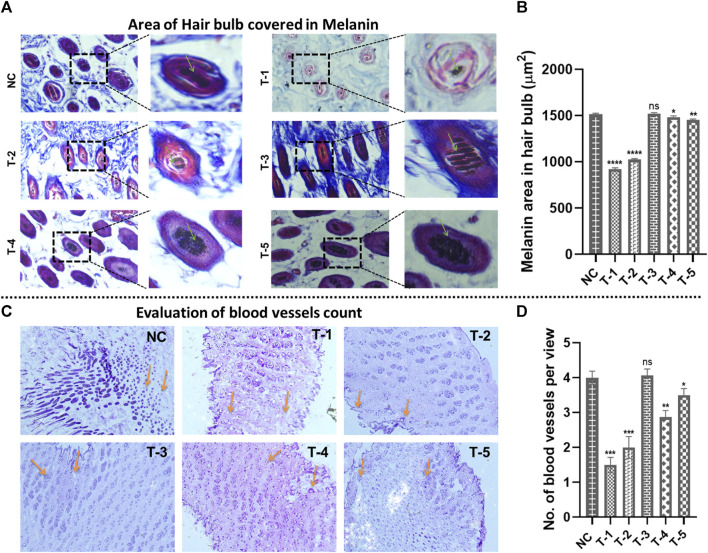
FIGURE 6.
Microscopic analysis in skin sections retrieved on day 21 of experiment after H&E staining: (A) morphology of the area of the hair bulb covered in melanin in skin sections from different treatment groups (arrows representing the area covered by the hair bulb in melanin). (B) Comparison of the morphology of the area of the hair bulb covered in melanin in skin sections from different treatment groups. Results are presented as n = 4 + SD; ****p ≤ 0.0001 denotes NC versus T-1 and T-2; **p ≤ 0.01 denotes NC versus T-5, *p ≤ 0.1 denotes NC versus T-4, and ns p > 0.05 denotes NC versus T3. (C) The number of blood vessels from different treatment groups (arrows representing no. of blood vessels per view). (D) Comparison of the number of blood vessels from different treatment groups. Results are presented as n = 4 + SD; ***p ≤ 0.0001 denotes NC versus T-1 and T-2; **p ≤ 0.01 denotes NC versus T-4, *p ≤ 0.1 denotes NC versus T-5, and ns p > 0.05 denotes NC versus T3.

