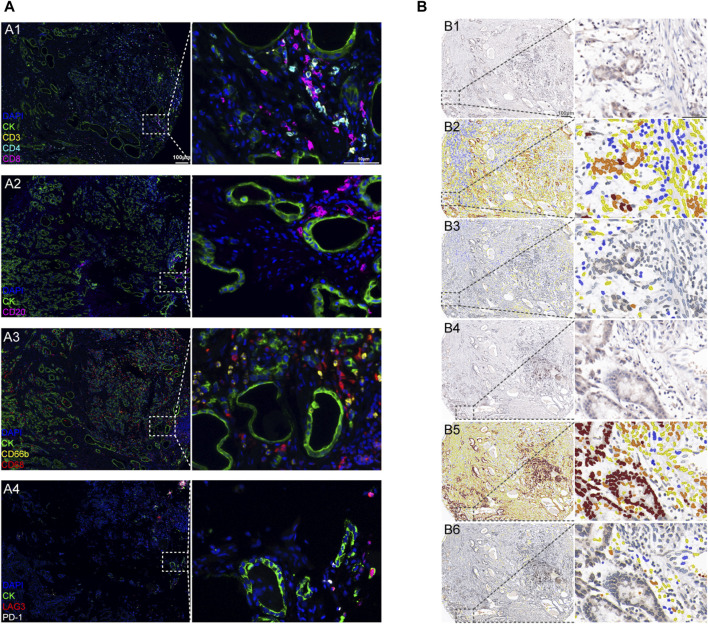
FIGURE 3.
Representative immunoreactivity patterns of TILs and immune checkpoint expression in gastric cancer tissues: (A) GC immune environment using multiplex fluorescence IHC (mIHC) panels scanned using Vectra software. A1: lymphocyte panel of CD3, CD4, and CD8 with CK staining. A2: B lymphocyte panel of CD20 with CK staining. A3: myeloid panel of CD66B and CD68 with CK staining. A4: immune therapy target panel of PD-1 and LAG3 with CK staining (green: CK; blue: DAPI; left column magnification ×20; right column magnification ×400). (B) Quantified protein expression using the immunohistochemistry (IHC) score (intensity: brown, intense staining; orange, moderate staining; yellow, weak staining; and blue, no staining. Left column magnification ×20; right column magnification ×400). B1: CTLA4 in cancer tissues. B2: CTLA4 expression in cancer cells was scored using software. B3: CTLA4 expression in TILs was scored using software. B4: PD-L1 in cancer tissues. B5: PD-L1 expression in cancer cells was scored using software. B6: PD-L1 expression in TILs was scored using software.

