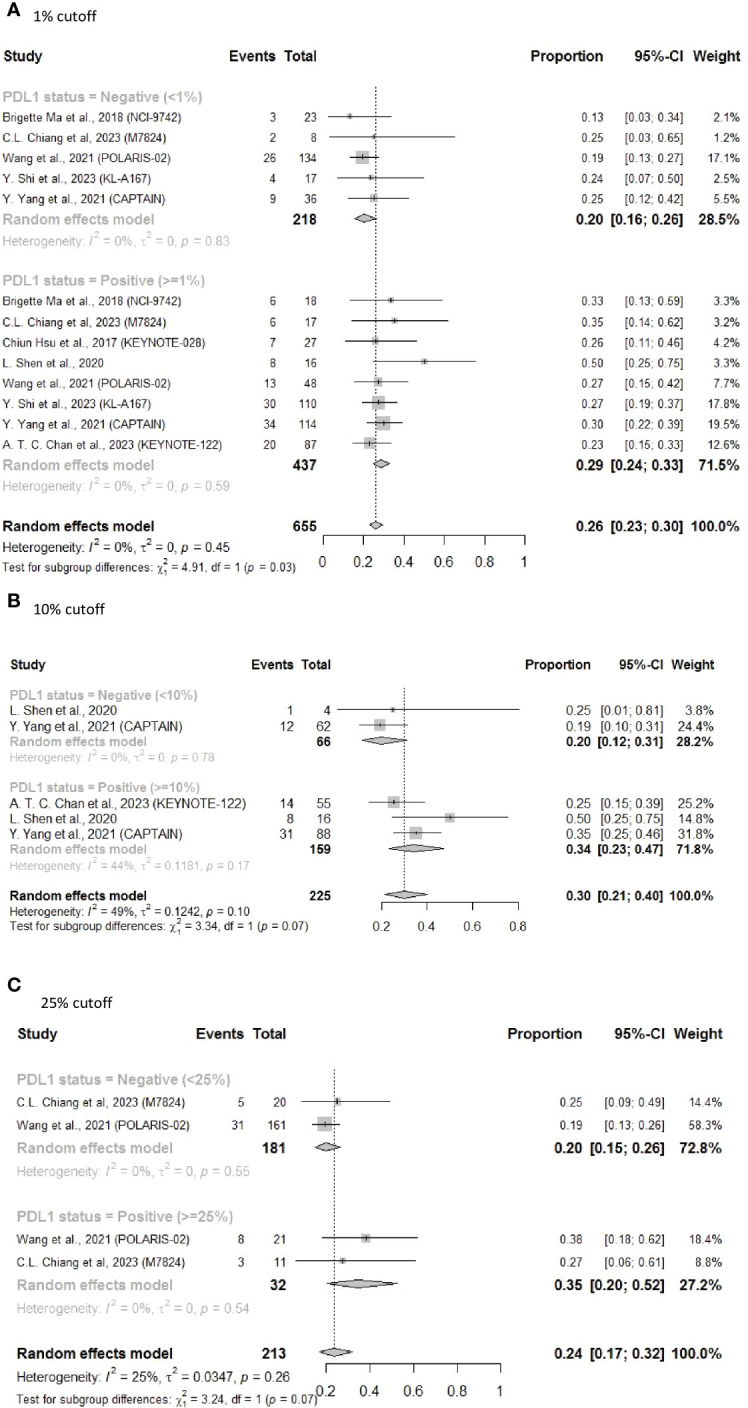
Figure 4.

Forest plot of ORR in sensitivity analysis excluding patients who received combined immunotherapy and targeted therapy as subsequent-line treatments. (A) 1% cutoff; (B) 10% cutoff; (C) 25% cutoff.

Forest plot of ORR in sensitivity analysis excluding patients who received combined immunotherapy and targeted therapy as subsequent-line treatments. (A) 1% cutoff; (B) 10% cutoff; (C) 25% cutoff.