
FIGURE 4.
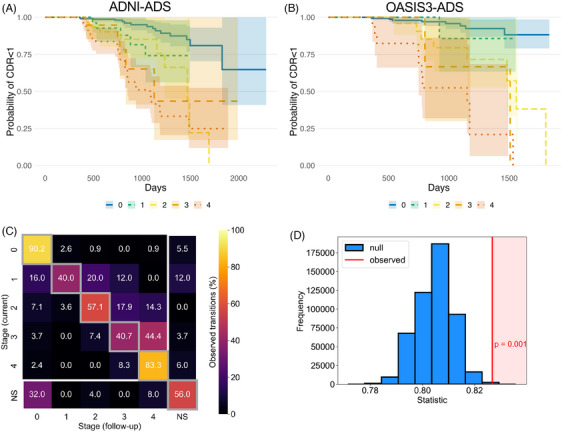
Assessment of FTP staging with longitudinal clinical and imaging data. (A) A survival analysis evaluated the risk of progressing to dementia (CDR >= 1) for each FTP stage in ADNI‐ADS. Nonstageable (NS) individuals are omitted for visual clarity (see Figure S6). (B) Same as (A), but with OASIS3‐ADS. (C) Heatmap showing the longitudinal progression of FTP staging in ADNI‐ADS. For all individuals with longitudinal FTP scanning, we tabulated the stage labels for all successive scan pairs. Rows indicate the stage of the current scan while columns indicate the stage of the follow‐up scan. The counts within each row are normalized to percentages. Boxes on the diagonal (gray squares) represent no change in stage between visits. Boxes above the diagonal represent increasing stage between visits, while boxes below the diagonal represent reverting stage (omitting the NS scans shown in the last row and column). (D) A permutation test was applied to the stage transition data (C) to evaluate longitudinal FTP staging. The statistic of interest was the proportion of scan pairs where the stage increases or stays the same, corresponding to the upper triangle of the heatmap matrix (including the diagonal but omitting the last column). The histogram shows the simulated null distribution of the statistic, while the red line shows the observed statistic and p‐value. Longitudinal FTP staging analysis was only conducted in ADNI‐ADS, due to a lack of data in OASIS3‐ADS. CDR, Clinical Dementia Rating; FTP, flortaucipir; NS, nonstageable.