
FIGURE 5.
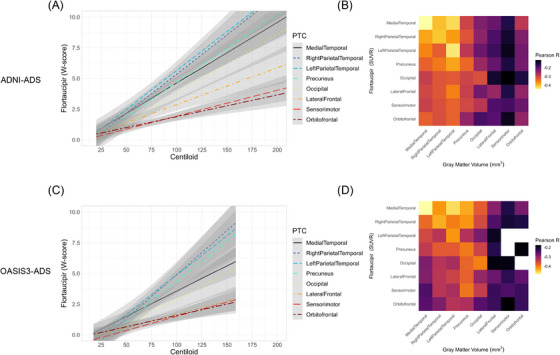
Comparison of FTP uptake in PTCs with amyloid burden and gray matter loss. (A) In ADNI‐ADS, linear regressions were used to model FTP accumulation with increasing Centiloid in each PTC. Tau uptakes are measured as W‐scores in each PTC. (B) Heatmap showing partial correlations between FTP uptake and gray matter volume in all pairs of PTCs. Cells on the diagonal represent correlations between FTP and gray matter volume in the same PTC, while off‐diagonal cells represent inter‐regional associations (rows = FTP, columns = gray matter). The fill is proportional to the partial correlation (adjusted for age); correlations which were not significant after correction for multiple comparisons are filled with white. (C‐D) Same as (A‐B), but with OASIS3‐ADS. FTP, flortaucipir; PTC, Pattern of Tau Covariance.