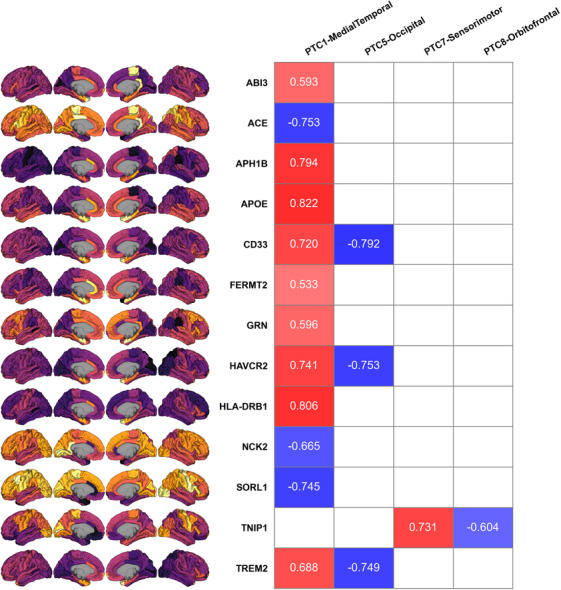
FIGURE 6.

Comparison of PTCs with expression maps for AD‐related genes. Numbers in the table are Pearson R coefficients for significant associations between genes (rows) and PTCs (columns) (0.01 < p < 0.05 for all p‐values). Redder coloring indicates stronger positive correlation, while bluer coloring indicates stronger negative correlation. Nonsignificant associations are shown as empty cells. Brain panels on the left show Allen Brain Atlas gene expression for each gene. No significant associations were found for four of the eight PTCs (PTC2, PTC3, PTC4, and PTC6) and are not included in this figure. AD, Alzheimer's Disease; PTC, Pattern of Tau Covariance.
